Vantage Launches Count Display Type for Cost Reports
Set a Cost Report's Y-Axis to Count to see how many distinct resources, services, models, or seats contributed to spend over time.
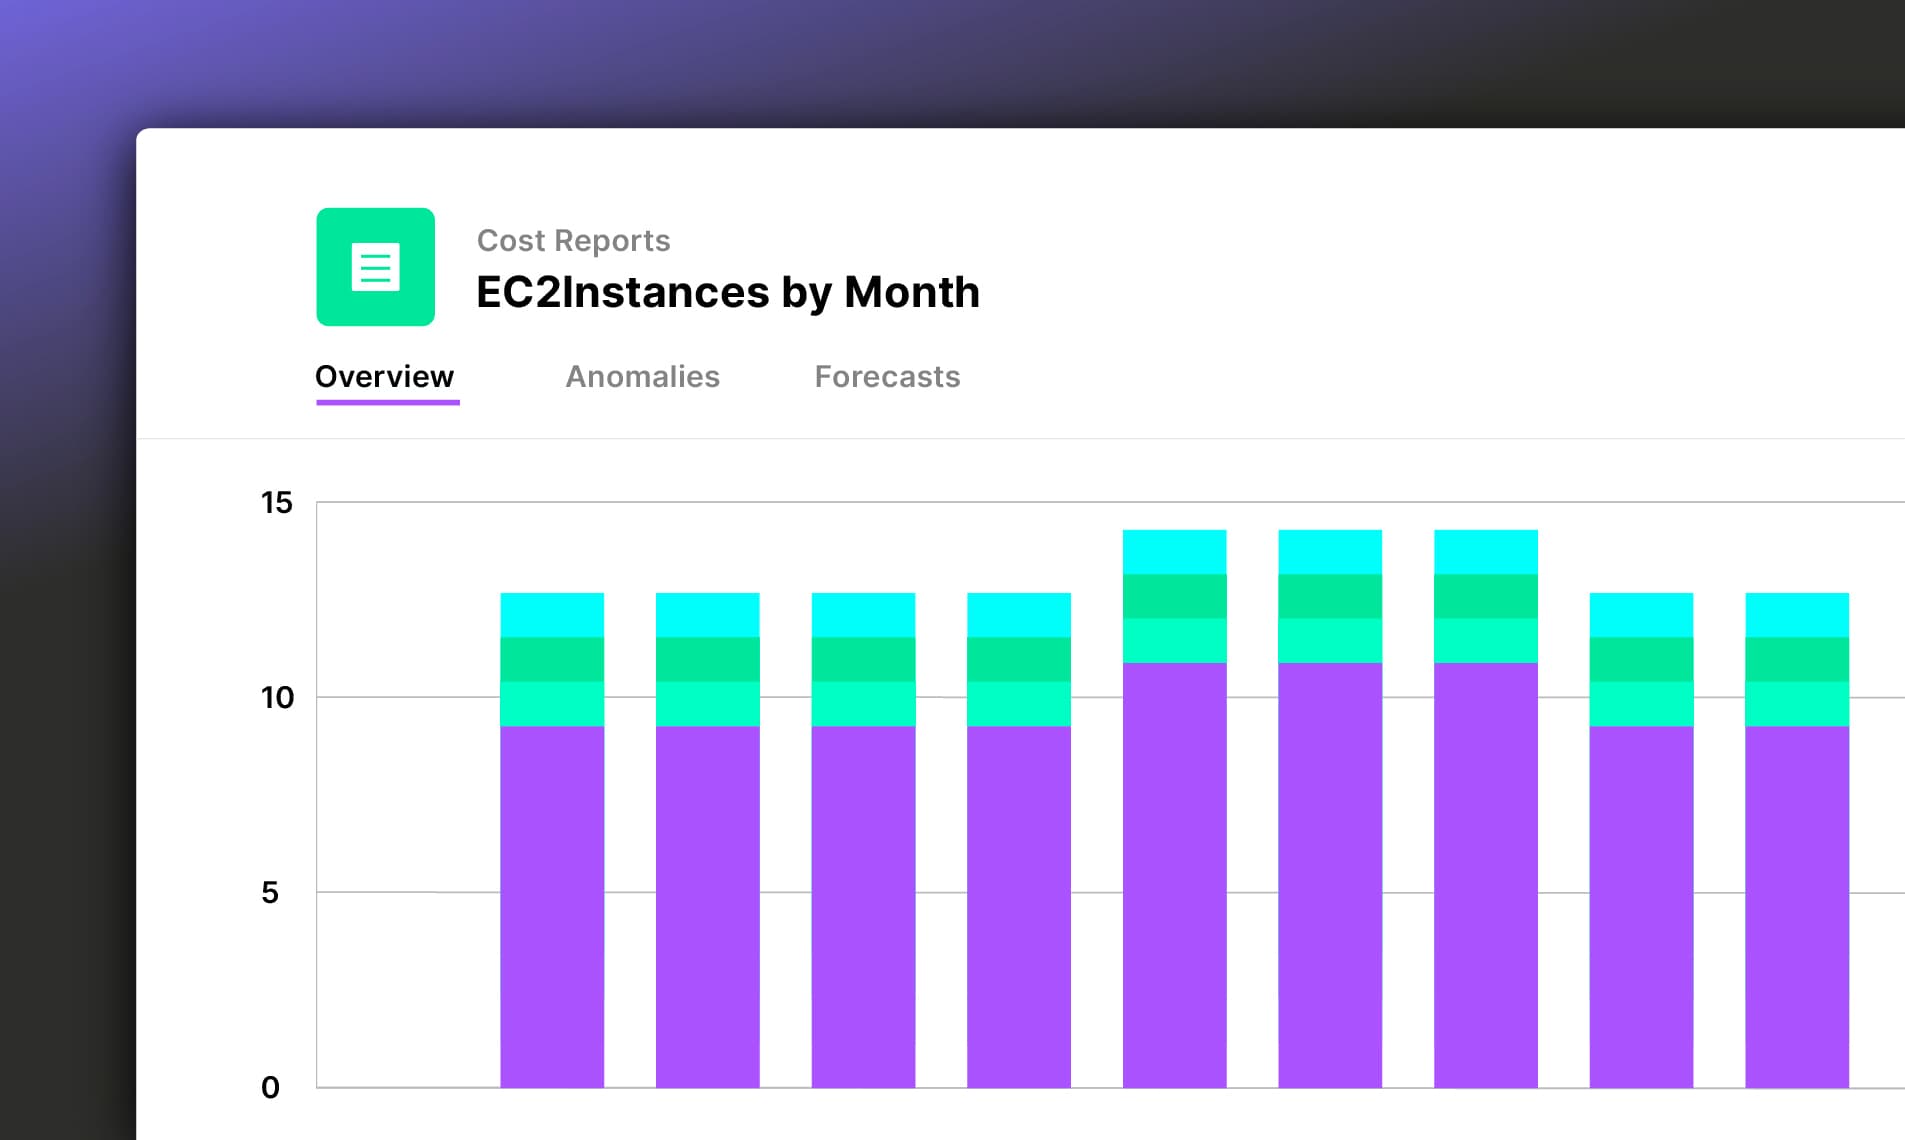

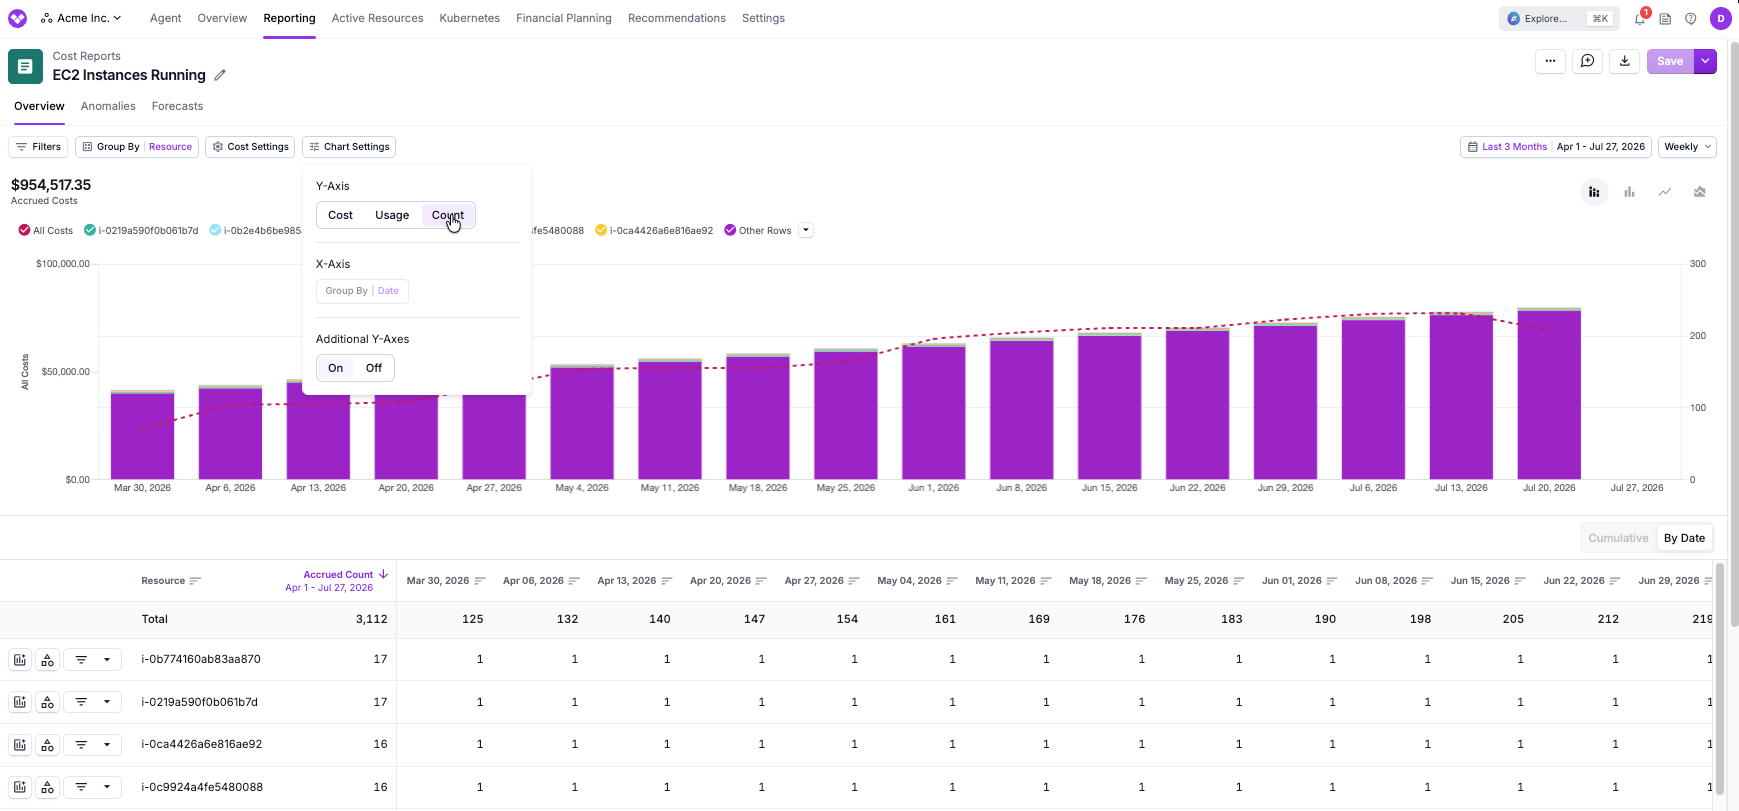
Today, Vantage is launching Count as a display option in Cost Reports settings, allowing customers to show how many distinct permutations of infrastructure they are running over time. Alongside the existing Cost and Usage views, customers can now set a report's Y-Axis to Count and view the unique count of their Group By in each time period, such as how many EC2 instances were running, how many LLM models a team used, or how many users hold Cursor seats.
Previously, Cost Reports visualized Cost and Usage metrics to help customers understand the consumption driving their infrastructure spend. Increasingly, teams also want visibility into how the underlying infrastructure scales over time, enabling them to better explain cost trends and identify the resources responsible for changes in spend. Understanding the growth in the footprint of an environment—such as distinct resources, services, models, or seats—historically meant exporting data for specific periods and performing counts outside of Vantage, or reimporting data as a Business Metric that already existed in Vantage.
Now, with the launch of Count displays on Cost Reports, Vantage users can view trends in the number of distinct values for any attribute supported as a Group By dimension. This allows teams to create reports that reveal how their environments evolve over time, for example, counting distinct EC2 instances by grouping on Resource, the number of services a team uses by grouping on Service, the LLM models in use by grouping on a model tag, or the number of Cursor seats driving costs by grouping on a user tag. Counts can be viewed by opening the Chart Settings menu on any Cost Report and selecting Count for the Y-Axis. The chart displays the distinct count of the report's Group By values within each time bin, while the accompanying table shows the total count for each time period and indicates whether each grouped value existed within that time bin. Count displays are available in the Vantage console on Cost Reports and through the /costs API, enabling programmatic access for the FinOps Agent, Canvas, and other integrations.
Count is available today to all Vantage customers. To get started, open any Cost Report, click Chart Settings, and select Count for the Y-Axis. For more information, see the Cost Reports documentation.
Frequently Asked Questions
1. What is being launched today?
Vantage is launching Count as an aggregate dimension for Cost Reports. When a report is set to Count, Vantage shows the number of distinct permutations of the report's Group By in each date bin, plotted over time. It answers "how many distinct things were running" rather than "how much did they cost" or "how much did they consume." Count is configurable in the console, retrievable via the /costs API, and can be utilized by the FinOps Agent and Canvas.
2. Who is the customer?
Any Vantage customer who wants to track the breadth of their footprint over time, not just its dollar magnitude—FinOps practitioners, platform teams, and engineering leaders. It is especially useful for teams watching resource sprawl (instances, volumes, clusters), AI/LLM adoption (distinct models per team), and SaaS seat growth (e.g., Cursor or Datadog users).
3. How much does this cost?
There is no additional cost to use Count displays in Cost Reports.
4. How do I view Count on a Cost Report?
Open any Cost Report, apply the filters, date bin, and Group By applicable to your analysis, then open the Chart Settings menu and select Count for the Y-Axis. The Cost Report chart updates to show the count of distinct groupings per date bin over your selected timeframe. The Cost Report Table will show the total count for each time bin as the top row, and will show a binary indicator for each date bin that a row exists in.
5. What values are plotted for Count?
Count returns the number of distinct values of your Group By that have data within each date bin. If you group by a single dimension, you get the count of distinct values of that dimension (e.g., group by Resource → number of distinct resource IDs). If you group by multiple dimensions, you get the count of distinct combinations (e.g., group by Provider and Service → number of distinct provider/service pairs). A grouping is counted in a bin if it has cost in a given date bin.
6. What can I count by?
Count works with the same groupings available elsewhere in Cost Reports and the /costs API: account_id, billing_account_id, charge_type, cost_category, cost_subcategory, provider, region, resource_id, service, tagged, and any tag (tag:<key>).
7. What are example reports that I can create using Count Cost Reports?
Some example reports this can be used for include:
- Show growth in the footprint of EC2 instances by filtering to EC2 and grouping by Resource
- Track the distinct Anthropic models used over time by grouping by Service
- Show the number of Cursor users by grouping by Resource
8. How does the date bin affect the count?
The count is computed per date bin. With a monthly bin, a resource that appears at any point in a month is counted once for that month; with a daily bin, it is counted on each day it has data. Changing the date bin (day, week, month, quarter, hour) changes the granularity of the count the same way it changes Cost and Usage. For example, distinct daily instance counts will differ from a single monthly count over the same range.
9. Which chart types does Count support?
Count is a single number per date bin, so it renders on any time-series chart types (line, multi-bar, stacked-bar, and area). Pie charts are not supported for Count cost reports.
10. Can I see the underlying values, not just the number?
The chart plots the count per bin; the report table shows the total count per time period, as well as the individual groupings count per date bin. This allows you to see which distinct resources, services, models, or tag values make up the count for a period.
11. Can I retrieve Count via the API?
Yes. The /costs endpoint accepts count as an aggregation alongside cost and usage. Pass it the same way you already control aggregation today:
You can also query for the costs of any saved report by its token from /costs, and if saved with settings[aggregate_by] = count, the returned result will provide count by period.
12. Can I set Count as a report's saved display via Terraform?
The chart_settings.y_axis_dimension attribute of the vantage_cost_report resource, which currently accepts cost and usage, now includes count:
13. Can I use Count in Canvas?
Yes. A Cost Report set to Count can be displayed in Canvas, so you can place a "distinct models in use" or "instances running" chart next to spend and usage views in the same narrative.
14. Can I use Count on a Dashboard?
Yes. A Cost Report's display type carries through to where the report is shown.
15. How is Count different from Usage?
Usage measures how much of a resource was consumed (GB-hours, requests, tokens) and is denominated in usage units. Count measures how many distinct things existed, denominated as a plain number. Spend can rise because usage per resource increased (a Usage story) or because the number of distinct resources increased (a Count story); having both lets you tell them apart.
16. If something has no grouping, is that included in a count?
Yes. If a cost does not have a value for what you grouped by, it still gets counted. For example, if you group by Resource, some costs like tax, support, and account-level fees do not have a resource attached to them. Vantage groups all of these together as a single No Resource row, which adds 1 to your count. You can see this row in the table below the chart, so you can tell when it is part of your count.
Sign up for a free trial.
Get started with tracking your cloud costs.