Analyzing AWS Cost Data to Improve Your Cloud Cost Management Strategy
Reading and analyzing Cost Explorer data can sometimes be confusing. We provide essential tips to ensure you make the most out of your cloud cost data analysis.

When planning, budgeting, or forecasting for a new year, Cost Reports are one of a FinOps practitioner's most handy tools for reviewing current costs as well as predicting future costs. In AWS, practitioners can review costs and apply detailed filters via AWS Cost Explorer. Reading and analyzing this data can sometimes be confusing—and there are some very important caveats to be aware of. From understanding various cost categories in Cost Explorer, to understanding how to view and filter for discounts, we've got you covered with some tips for making the most of your analysis.
At a high level, we'll dive into the following topics:
- The EC2-Other cost category
- Blended vs. unblended vs. amortized cost views
- Discounts, like the AWS Enterprise Discount Plan
- Per-resource costs
What Is EC2-Other?
The EC2-Other category in Cost Explorer comprises a number of subcategories, including:
- EBS volume usage
- EBS snapshot usage
- CPU credits from t2/t3/t4g EC2 instances
- NAT gateway usage
- Data transfer
- Idle elastic IP address usage
Oftentimes, this category is confusing, since it's a catch-all for a number of seemingly unrelated categories. If the majority of your bill comprises this category, then it's often hard to forecast exactly what is driving those costs. Costs are grouped into one bucket rather than being associated with the resources—such as an individual NAT gateway—that contributed to those costs.
How to Filter for EC2-Other
In Cost Explorer, use the following filter criteria to filter on EC2-Other costs:
- Filter by: EC2 - Other
- Group by: Usage type
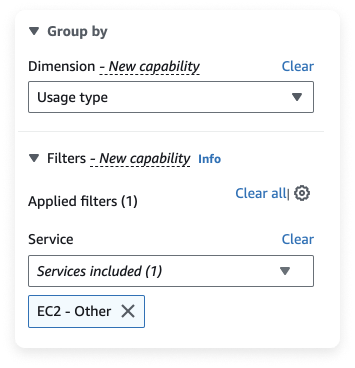
Filter and Group settings in Cost Explorer
On the other hand, when Vantage ingests data from the Cost and Usage Report (CUR), it's enriched. EC2-Other is reallocated into direct line items. For example, if you narrow down the analysis to NAT gateway expenditures, the charges initially categorized under transit or egress in EC2-Other are assigned to the individual resource that contributed to the charge.
This means that instead of having a general spending category for transit, as seen in Cost Explorer, you now see the expenses allocated to the specific NAT gateway or EC2 instance responsible for those costs. As seen below, costs are broken down to a specific NAT gateway in the report, so you can focus on exactly what drives those costs.

Decoding Blended, Unblended, and Amortized Costs
Your organization will likely have its own philosophy when allocating cloud costs. As a result, it's important to have a solid understanding of the three main cost metrics available in Cost Explorer: unblended, amortized, and blended costs.
Unblended vs. amortized vs. blended costs in Cost Explorer
To toggle between these views in Cost Explorer, select an option under Advanced options > Aggregate costs by.
If you use Savings Plans or Reserved Instances, you may want to more accurately allocate costs based on the account that realized the discount. The amortization logic in Vantage attributes costs to the account that benefited from the discount, providing a more accurate reflection of usage.
In the example below, a Cost Report is filtered by the Service of Savings Plans for AWS Compute usage. The amortization logic is initially disabled, and the Savings Plan is attributed to the main account (in this example, named Vantage). Once amortization is enabled, the portion of the commit that was used by each account (i.e., production, staging, and others) is accounted for.

If you want to align the view in Vantage to Cost Explorer, disable amortization in Vantage and compare the numbers to unblended costs in Cost Explorer.
Understanding Discounts: Savings Plans, Reserved Instances, and Enterprise Discounts
Organizations with substantial AWS cloud computing spend can leverage various discount programs to save on cloud costs. For example, the AWS Enterprise Discount Program (EDP) rewards customers with higher spend (i.e., greater than $1 million in spend) for long-term commitments. By committing to a specific spend amount, and a defined period—typically one to three years—enterprises can obtain substantial discounts on their AWS services. These discounts are applied to a range of AWS services—not just EC2 or compute services as seen in Savings Plans. The level of discount is often tied to the volume of services consumed by the enterprise.
Other discounts include options like Savings Plans and Reserved Instances. You pay upfront for Reserved Instances and receive a discount. With Savings Plans, you commit to specific usage for a discount (up to 72%!). They offer more flexibility because with Reserved Instances you are locked in to use a specific instance and family, while with Savings Plans, you commit to specific usage—over a one- to three-year term.
Filtering Costs Reports for Discounts
When viewing and analyzing Cost Reports, a potential challenge arises if you filter reports based on specific criteria, such as an individual resource. In Vantage, you can view costs grouped by Charge Type to get a full understanding of your discounts.
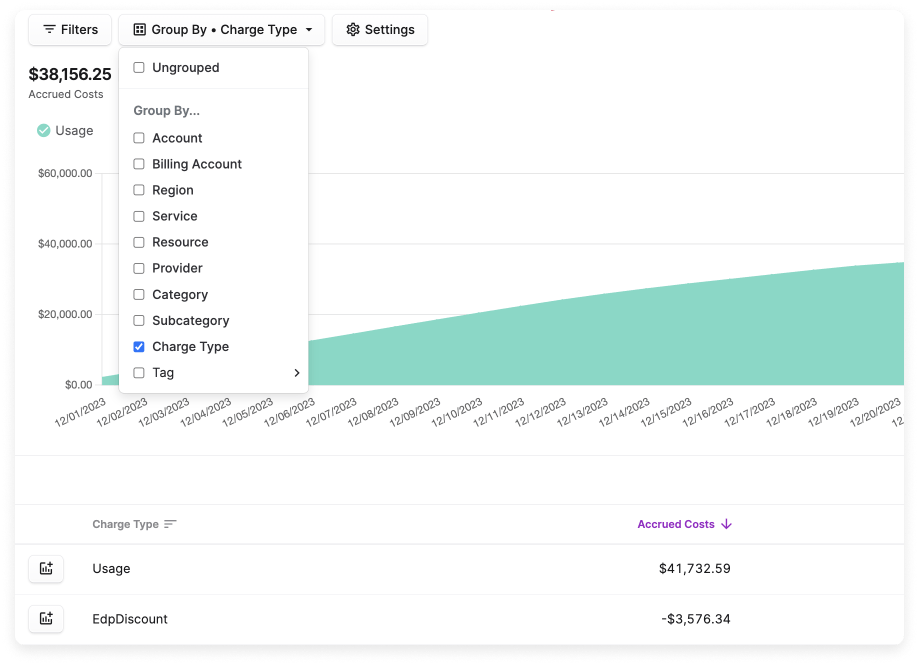
Grouping costs by Charge Type in the console
If you further filter your costs to specific resources (in this example, a specific group of EC2 instances), the discount is no longer viewable, and you see only usage.
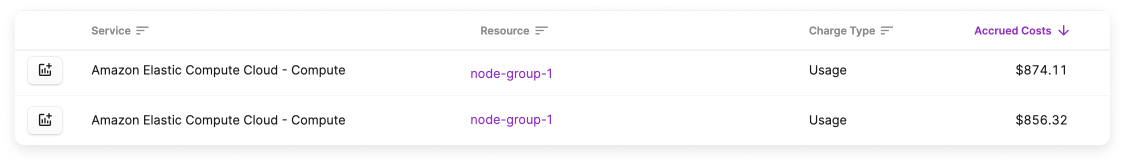
Filtered resources in the console
Because these discounts are negotiated for specific services at the account level, if the filtering criteria excludes the entire scope of the account where the discount is applied, the discount may not be accurately reflected in the filtered report.
As a best practice for understanding your total month's costs, first remove all discounts, amortizations, etc. to view total accrued costs. Then, add back discounts or credits to see the net effect of these items on your overall monthly costs.
Per-Resource Costs
Per-resource costs are helpful to see the individual resources that are contributing to costs. In Cost Explorer, you can view resource-level granularity for the past 14 days. Note that this setting is not enabled by default, and you need to activate it in your Cost Explorer preferences. As a best practice, group first by service to see where there may be anomalies in your overall cost data. If you observe an anomaly, filter by service and then group by resource to see the exact resource that is driving that anomaly.
Note that in Cost Explorer, you are limited to the two-week time period for viewing these costs—but what if you want to understand resource requirements over a longer timeframe? For instance, you are preparing for a major sales event and you want to view resource-level costs and trends for more than 14 days. Seasonal events often exhibit patterns that extend beyond a 14-day window. By analyzing costs over a more extended period, you can identify trends and patterns in resource usage, helping you anticipate future demand and optimize resource provisioning accordingly. This is beneficial for many reasons, including:
- Optimize Reserved Instances or Savings Plans: With a longer timeframe, you can better assess whether Reserved Instances or Savings Plans are suitable for your infrastructure. These commitment-based pricing options require a deeper understanding of resource utilization over an extended period.
- Better anomaly detection: An extended analysis allows you to associate specific costs with specific phases of the project or business cycle. In addition, anomalies or unexpected spikes in resource costs may become more apparent over a more extended timeframe, providing opportunities to investigate and optimize.
- Budget planning and forecasting: For financial planning purposes, especially when preparing budgets for upcoming projects or events, having data beyond 14 days is important. It allows you to estimate costs more accurately and allocate resources effectively to alleviate over-provisioning.

Per-resource costs over a multi-week timeframe
In the image above, a Cost Report is grouped first by service and then by resource over a seasonal timeframe. This analysis shows a big spike in usage for a particular Redshift instance, which helps you to understand what resources you may need to scale for future seasonal events. Viewing this data over only a 14-day timeframe misses the full picture of usage for this resource.
Conclusion
By employing the right filters and grouping criteria in tools like Cost Explorer and Vantage, you can gain valuable insights into your cloud expenses. Understanding various filter criteria and exactly what you are viewing is crucial for optimizing resource usage, detecting anomalies, and enhancing budget planning and forecasting.
Sign up for a free trial.
Get started with tracking your cloud costs.