Vantage Launches Canvas: An AI-Enabled Business Intelligence Dashboard
Create persistent, customizable reports from natural language prompts.
Today, Vantage is launching Canvas: an AI-enabled, customizable dashboarding tool. Customers can now create persistent, interactive reports in whatever tabular format they’d like, incorporating any representation of the data they have in Vantage, all managed by writing a prompt.
Canvases can render persistent, interactive reports via the FinOps Agent using any data in the Vantage platform.
From Day 1, Vantage has focused on design and ease of use for both a best-in-class visual experience and data accessibility. It’s in the ethos of the name of the company: we are all about giving you the best view of your infrastructure costs. Once you have that view, your teams can make better business decisions. Creating custom reporting has historically relied on both knowledge of tooling as well as the underlying dataset, requiring a significant time and people investment for any organization. In the AI era, this no longer has to be the case. Since launching the FinOps Agent in November 2025, we have seen teams creating unique views of their data, sharing them with teams in Slack, and asking the agent to update their data for continued reporting. Using agents is now the default for building reports, and traditional reporting methods should not constrain what the agent can produce on teams’ behalf.
Today, we are launching Canvas: a new type of report that allows you to create customized, interactive, and persistent views of your data in any tabular format. Canvases are a new, distinct primitive on Vantage that consist only of a title and a prompt. When a prompt is sent to Canvas, the FinOps Agent pulls data from both the Vantage MCP and supported MCPs, performs calculations, makes comparisons, and renders data however you specify.
A few examples are below with their corresponding prompts:
- Department Spend Report: “Create a report that shows me rows from my
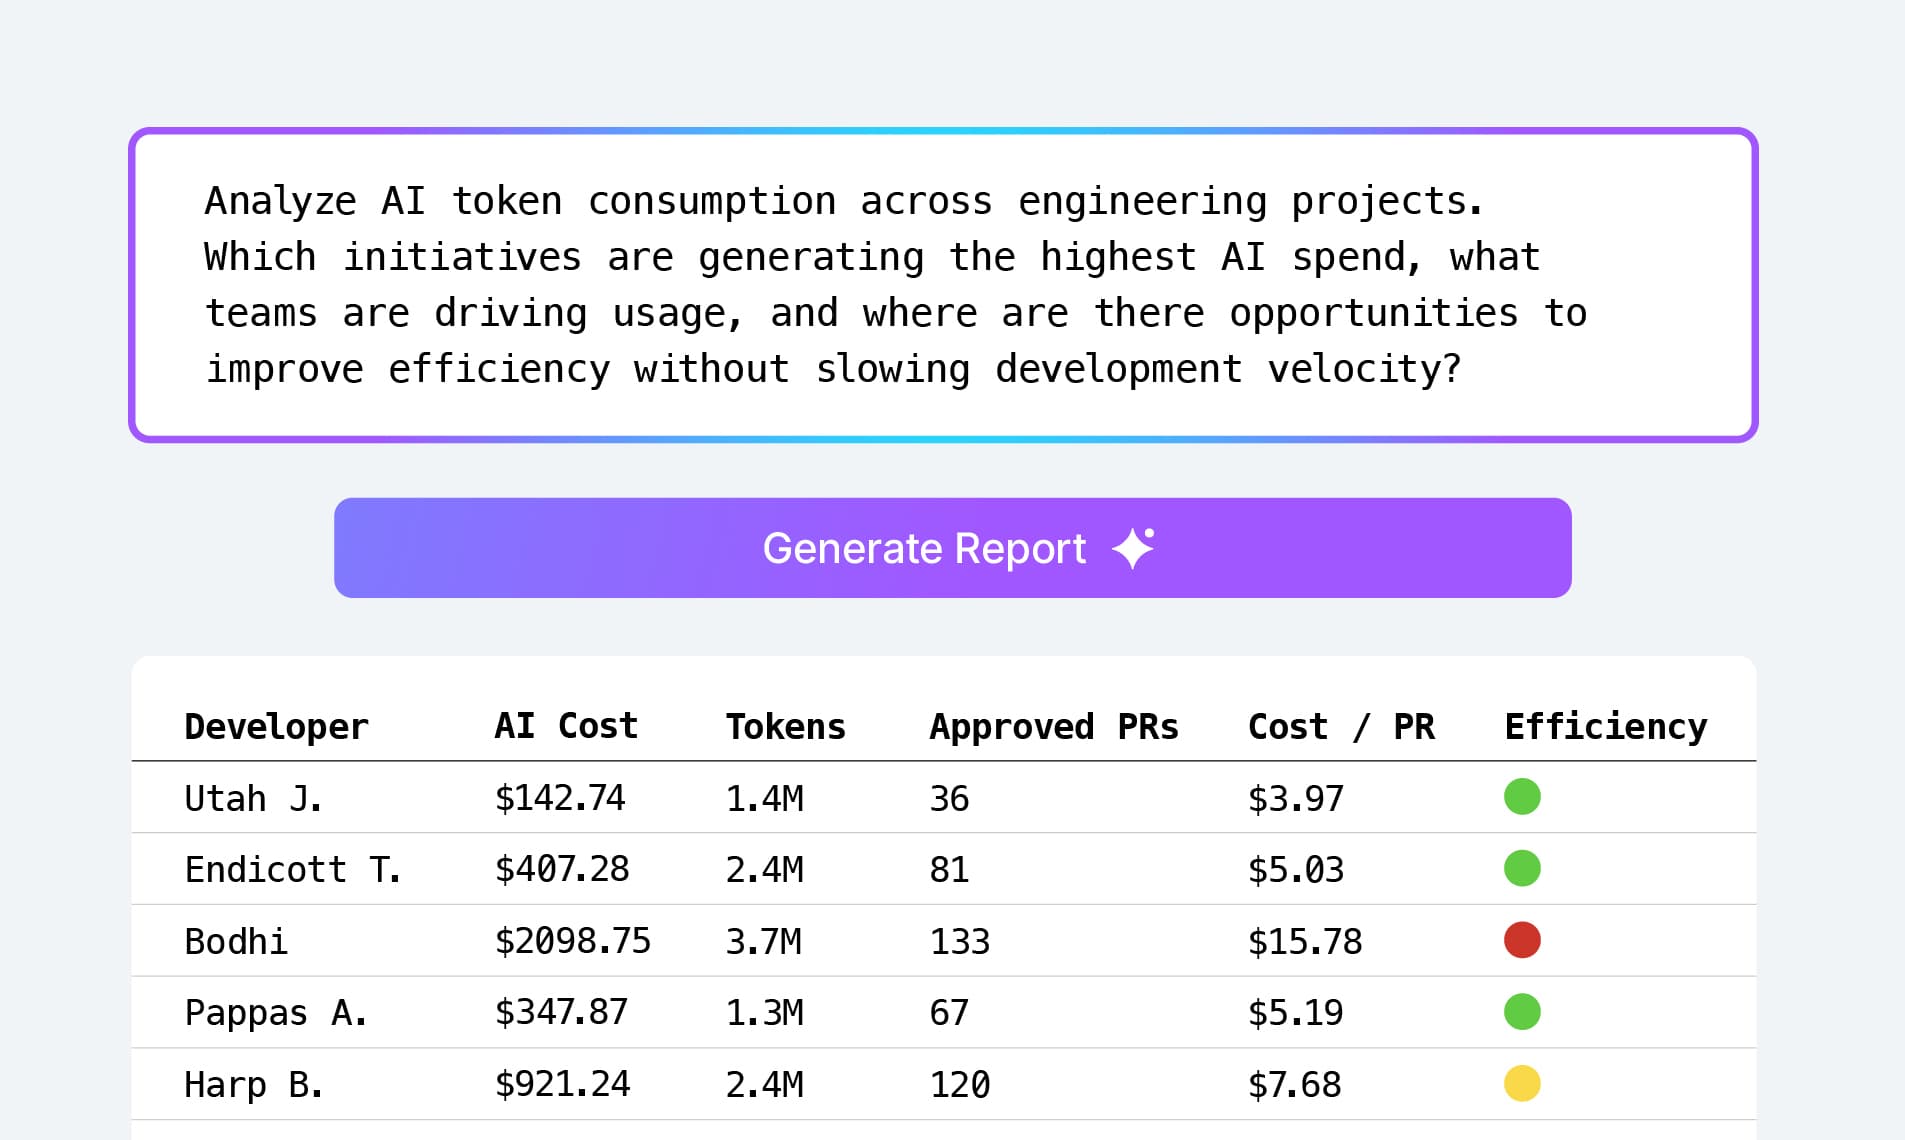
departmentvirtual tag values. The columns should show me their weekly accrued costs, the corresponding budget with a header of “target” instead of “budget”, then two computed columns of the difference in dollars vs percentage.” - Most-Efficient Developers: “Create a report that shows my top 10 developers by token consumption on Cursor. Pull in associated Linear issues closed out by those developers. Compute a unit-cost of ‘token spend per developer’ and sort by that column.”
- Customer Reporting: “Create a report that shows all of my
customersvirtual tag values, and their spend as a percent of our total spend. Provide this month over month.”
Canvases are available to all paying customers of Vantage. To get started, head to https://console.vantage.sh/canvases to create your first Canvas or choose from a list of supported Canvas prompts on our documentation.
Frequently Asked Questions
1. What is being launched today?
Today, Vantage is launching Canvas: an AI-enabled, customizable dashboarding tool. Customers can create a Canvas through natural language prompts to define data sources, columns, rows, calculations, filters, and presentation of any data within the Vantage platform, or supported MCP. This functionality increases the scope of workflows that can be done within the platform.
2. How much does this cost?
There is no immediate cost for Canvas. However, in time, we will be applying a token-based cost for the agent actions taken via Canvas.
3. Who is the customer?
This functionality is available to all paying customers of Vantage, and is especially valuable for executives and FinOps and Finance teams who need repeatable, leadership-ready reporting. It’s also great for engineering leaders and practitioners who want fast, prompt-driven reporting and deep dives without building and maintaining dashboards or spreadsheets.
This functionality is not available to customers in the free tier.
4. Where are Canvases located within Vantage?
The “Cost Reporting” section of the Vantage console has been renamed to “Reporting”. There is now a new section on the sidebar named “Canvas”. You’ll see a list of all of your Canvases there.
5. How do I create a Canvas?
When you navigate to the Canvas section of the console, you’ll see a button that says “New Canvas”. In order to generate a Canvas, all you need to do is enter a prompt. Once submitted, the FinOps Agent will dynamically pull all necessary data into the Canvas, and render the chart based on your prompt. You can iterate on this as many times as you like. Once completed, you can hit “Save”, and enter a title for your Canvas.
6. What properties does a Canvas have?
A Canvas has the following properties:
- A title (e.g., “Weekly Department Spend Report”)
- A prompt (a specific prompt that defines the Canvas that the FinOps agent will build for you)
- A chart (the rendered representation of the user’s prompt)
7. Which types of formats can a Canvas be rendered in?
At launch, a Canvas can show data in a tabular form. In future releases, it will support other chart types such as bar charts and line charts.
8. Can I include a Canvas on a Dashboard alongside Cost Reports?
Not at this time, however this will be available in the near future.
9. How do I change the table on my Canvas?
The prompt associated with generating your Canvas can be edited to update the report at any time. Head to any Canvas page, edit your prompt, and then click “Update Canvas”.
10. How often is my Canvas refreshed?
Each saved Canvas refreshes automatically once per day, or any time your prompt is changed with updates to the data you are including. The last refresh time is shown in the top-right corner.
11. Are there limits on prompt complexity or table size?
Very large or highly complex prompts may take longer to generate and are subject to a generation time limit (~3 minutes). If a prompt consistently times out, try narrowing the scope or breaking it into multiple Canvases.
12. Are Canvas updates logged in Audit Logs?
Yes. There are associated audit log events for create, update, and delete events for all Canvases.
13. Are Canvas links shareable?
Yes, Canvases can be shared with other users in your Vantage account. Every URL will have an associated token that the URL is composed of (e.g., https://console.vantage.sh/canvases/cnvs_abcde12345).
14. What happens if my prompt is invalid or the Canvas fails to generate?
If the agent can't fulfill a prompt, the Canvas surfaces an error message describing what went wrong, and you can edit the prompt and try again. Generation has a maximum processing window (~3 minutes); if it's exceeded, you'll see a timeout error rather than a partial result.
15. Do Canvases have RBAC?
Yes, you can use the same RBAC available to other report types to restrict reports to specific users or teams. When viewing a Canvas, click the ellipses in the top-right corner, and then select “Manage Access”.
16. Will the FinOps Agent create, update or delete any Vantage resources?
Canvas is a read-only feature: the agent reads from Vantage and connected sources to build the table, but it cannot modify your cost data, budgets, virtual tags, or any other Vantage configuration.
17. Does Canvas support non-USD?
Yes, Canvas will show the currency you have selected for your workspace.
18. Can I integrate data from other sources in addition to Vantage?
Not at time of launch, but in the near future, you will be able to integrate with third-party MCPs, such as Datadog, Linear, Notion, and more.
19. Is there API support?
Yes. Canvas has endpoints for create, list, show, update, and delete.
20. Is there Terraform provider support?
Terraform support will be available soon.
21. Can I export Canvases to CSV or PDF?
Export functionality is planned for a future release.
Sign up for a free trial.
Get started with tracking your cloud costs.