Datadog Tagging and Usage Attribution
Organizations can use usage attribution in Datadog to gain granular visibility into their spending and identify areas for optimization.
Usage attribution in Datadog enables organizations to report on monitoring data with tags and obtain insights into usage patterns. By using this feature effectively, organizations can gain granular visibility into their spending, identify areas for optimization, and ultimately use their tagging infrastructure to streamline cost allocation and facilitate informed decision-making.
What Is Tagging in Datadog?
The usage attribution feature first starts with good tagging hygiene. Datadog tags are labels that help to organize and make finding your various Datadog resources a lot easier. Tags typically comprise a key/value pair, such as env:prod or db:postgres. Tags can be assigned directly within a configuration file, the UI, via the API, or through DogStatsD. Within various views, you can filter data based on specific key/value pairs and group by tag keys. Below are a few tips for maintaining good tagging hygiene in your Datadog environment.
Aim for a Consistent Tagging Schema
Create a consistent tagging schema across all your resources and services. A consistent schema can better facilitate searching and filtering among your resources. In addition, ensure that all teams and departments, across your organization, follow the same tagging conventions. The unified service tagging feature uses the env, service, and version reserved tags across Datadog to help you identify specific applications. You can use this feature to consistently apply tags across your services and decrease manual tagging processes.
Use Tags to Provide Additional Resource Metadata
Create tags that provide additional metadata, like application version, deployment ID, owner, etc. These tags can help with troubleshooting and pinpointing specific deployments with issues.
Example tags include:
app_version:5.4container_id:123456owner:devops_team
Use Tagging for Cost Allocation
Use tagging to associate costs with specific resources or departments. These tags can help with accurately attributing costs. This is particularly useful in environments where multiple teams share resources, enabling better cost visibility and allocation.
Example tags include:
cost_center:financial_opsbusiness_unit:engineering
By implementing these strategies, you can establish a strong tagging framework in Datadog that enhances visibility, simplifies management, and enables more informed decision-making across your infrastructure.
A Note on Custom Metrics and Tags
As described in the Datadog Custom Metrics documentation:
If a metric is not submitted from one of the more than 700 Datadog integrations it’s considered a custom metric.
Adding tags for custom metrics might result in more custom metrics and a potentially larger bill. For example, imagine you are monitoring the performance of a video streaming service. Initially, you decide to track the playback latency of videos across two different genres.
Later, you realize you want to analyze the latency based on user device type. The combination of tags increases to four.
Now, you decide to further analyze the latency based on the geographical regions. The combination increases again to eight.
Each additional tag option provides deeper granularity for your monitoring data; however, consider the trade-off between granularity and cost, as adding more tags can increase the number of custom metrics and potentially affect your bill. Before adding a new tag to your custom metrics, consider whether it provides significant value or granularity to your dataset. Adding unnecessary tags can increase the number of custom metrics and subsequently increase your bill without providing actionable insights. In addition, make sure that you're not redundantly tagging metrics with information that is already represented in other tags. In the above example, say you wanted to add another tag for internet connection type, such as connection: broadband or connection: cellular. This might not significantly increase the level of granularity beyond what is already captured by the existing tags, since the device tag technically describes this same information.
What Is Usage Attribution in Datadog?
Usage attribution in Datadog provides organizations with fine-grained insights into their resource usage and associated costs. Users can assign up to three of their tag keys to their monitoring data to attribute specific usage within reports.
Note that usage attribution is an Enterprise feature, and you will need to work with Datadog Support to have it enabled in your account.
Once the feature is enabled, it might take up to a day for you to the tags applied.

Usage attribution screen in Datadog
(Source: Datadog documentation)
This feature is particularly valuable for organizations seeking to optimize their resource allocation, budgeting, and cost management strategies within Datadog. Users can analyze costs by each selected tag key to see where they can make adjustments to their workflows. Key functionalities of the usage attribution feature are noted below.
Datadog usage attribution feature breakdown
Common Ways to View Usage Attribution in Datadog
Because you are limited to three tag options for the usage attribution feature, you should select tags that make the most sense for analyzing costs and understanding where those costs originate. The following suggestions are based on tags we've seen used for usage attribution.
-
View by environment: Select usage attribution for any environment-related tags (e.g.,
env:production) to easily track costs across different environments. Pinpoint whether certain environments incur higher costs due to increased traffic or resource utilization, helping you allocate budgets effectively and ensure resource availability where it's needed the most. -
View by team: If you have multiple teams in your organization using Datadog, you can consider using corresponding team tags (e.g.,
team:software_engineering). You can then identify which teams consume more resources or generate higher costs for individual applications. -
View by application: Track which of your applications may be more expensive to monitor (e.g.,
application:myapplication). By analyzing costs at the service level, you can prioritize optimizations and investments based on the importance and resource consumption of each service.
Analyze Costs with Usage Attribution
You can use reports in Datadog to view usage for categories like products or organizations with daily, weekly, and monthly views. Finance teams can leverage the CSV export function to view the raw data in a spreadsheet or visualization tool outside of Datadog.

Usage attribution reporting view in Datadog
(Source: Datadog documentation)
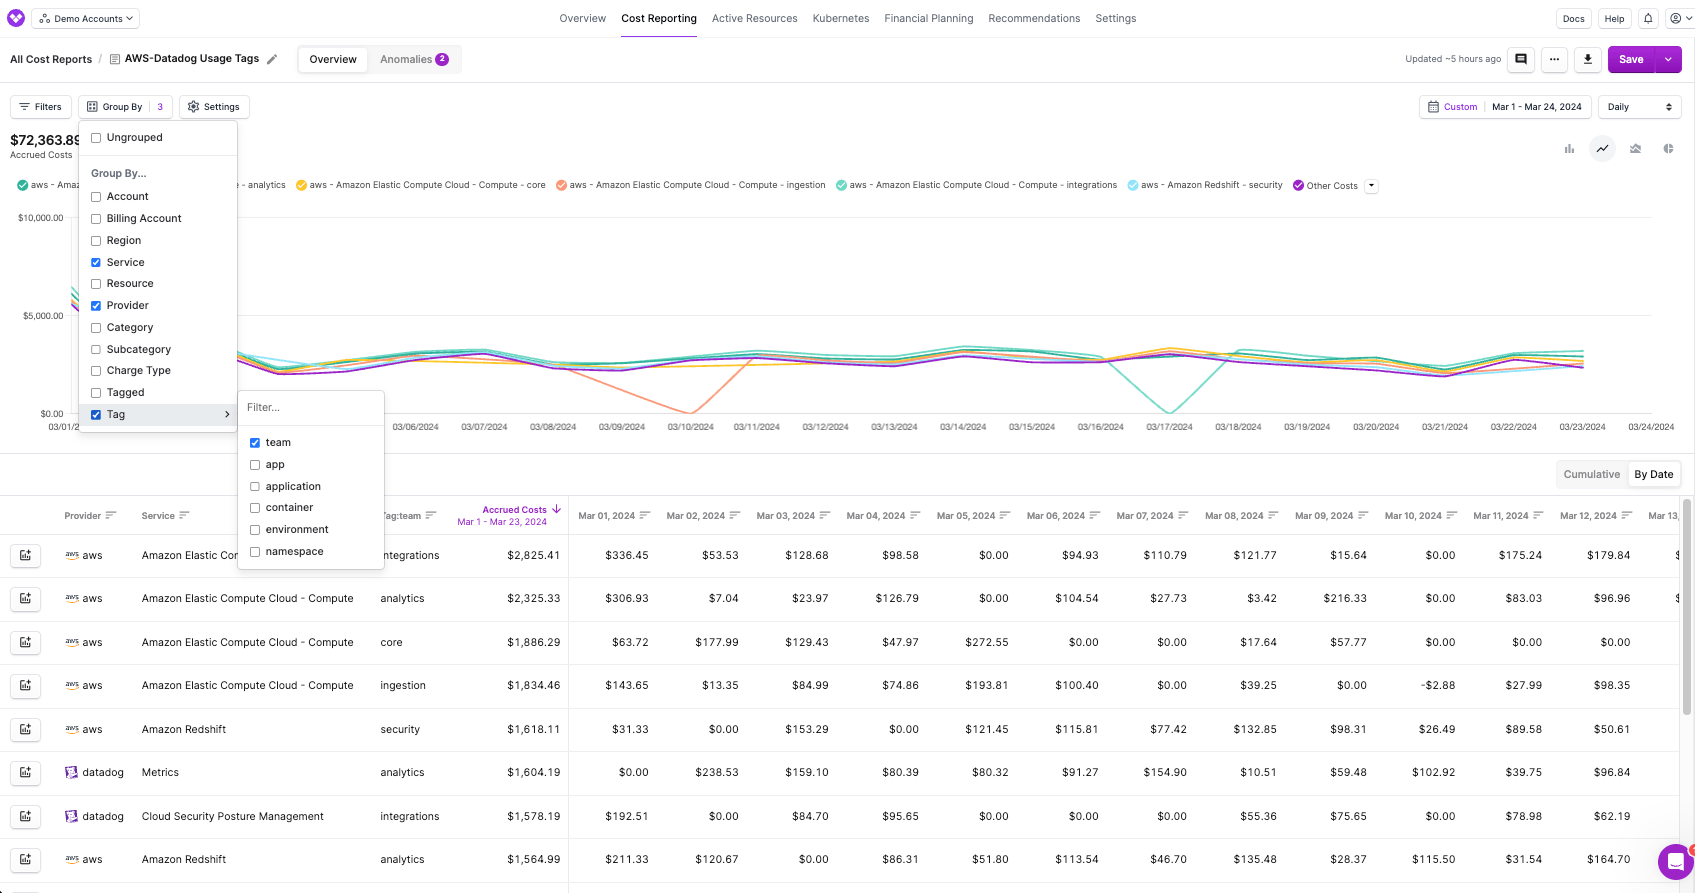
You can also use a third-party tool, like Vantage, which has support for ingesting Datadog usage attribution and cost tags. The benefit of using a tool like Vantage is that you can view Datadog costs alongside other providers, like AWS or GCP. You can easily filter costs across providers by the same tag to get a view of your total infrastructure costs.

In the below report, costs are filtered to AWS and Datadog and then grouped by service and corresponding team tags to show attribution for teams by services, across both providers. Cost trends can easily be attributed to individual teams or cost centers across your entire cloud infrastructure.
Conclusion
Along with an organized and efficient tagging strategy, engineering and FinOps teams can drill down into Datadog usage by environments, teams, or applications with usage attribution. For cross-provider usage analysis, you can view usage attribution via the Datadog integration with Vantage. Whichever method you decide works best for your organization, tracking costs via usage attribution promotes better cost visibility and optimization, enabling organizations to make data-driven decisions and effectively manage their resources across different platforms and services.
Sign up for a free trial.
Get started with tracking your cloud costs.