Vantage Launches KPI Widgets: Highlight Key Metrics on Dashboards
Show total spend, usage, budget performance, and other headline numbers as a single value on a dashboard, with the full reports below.
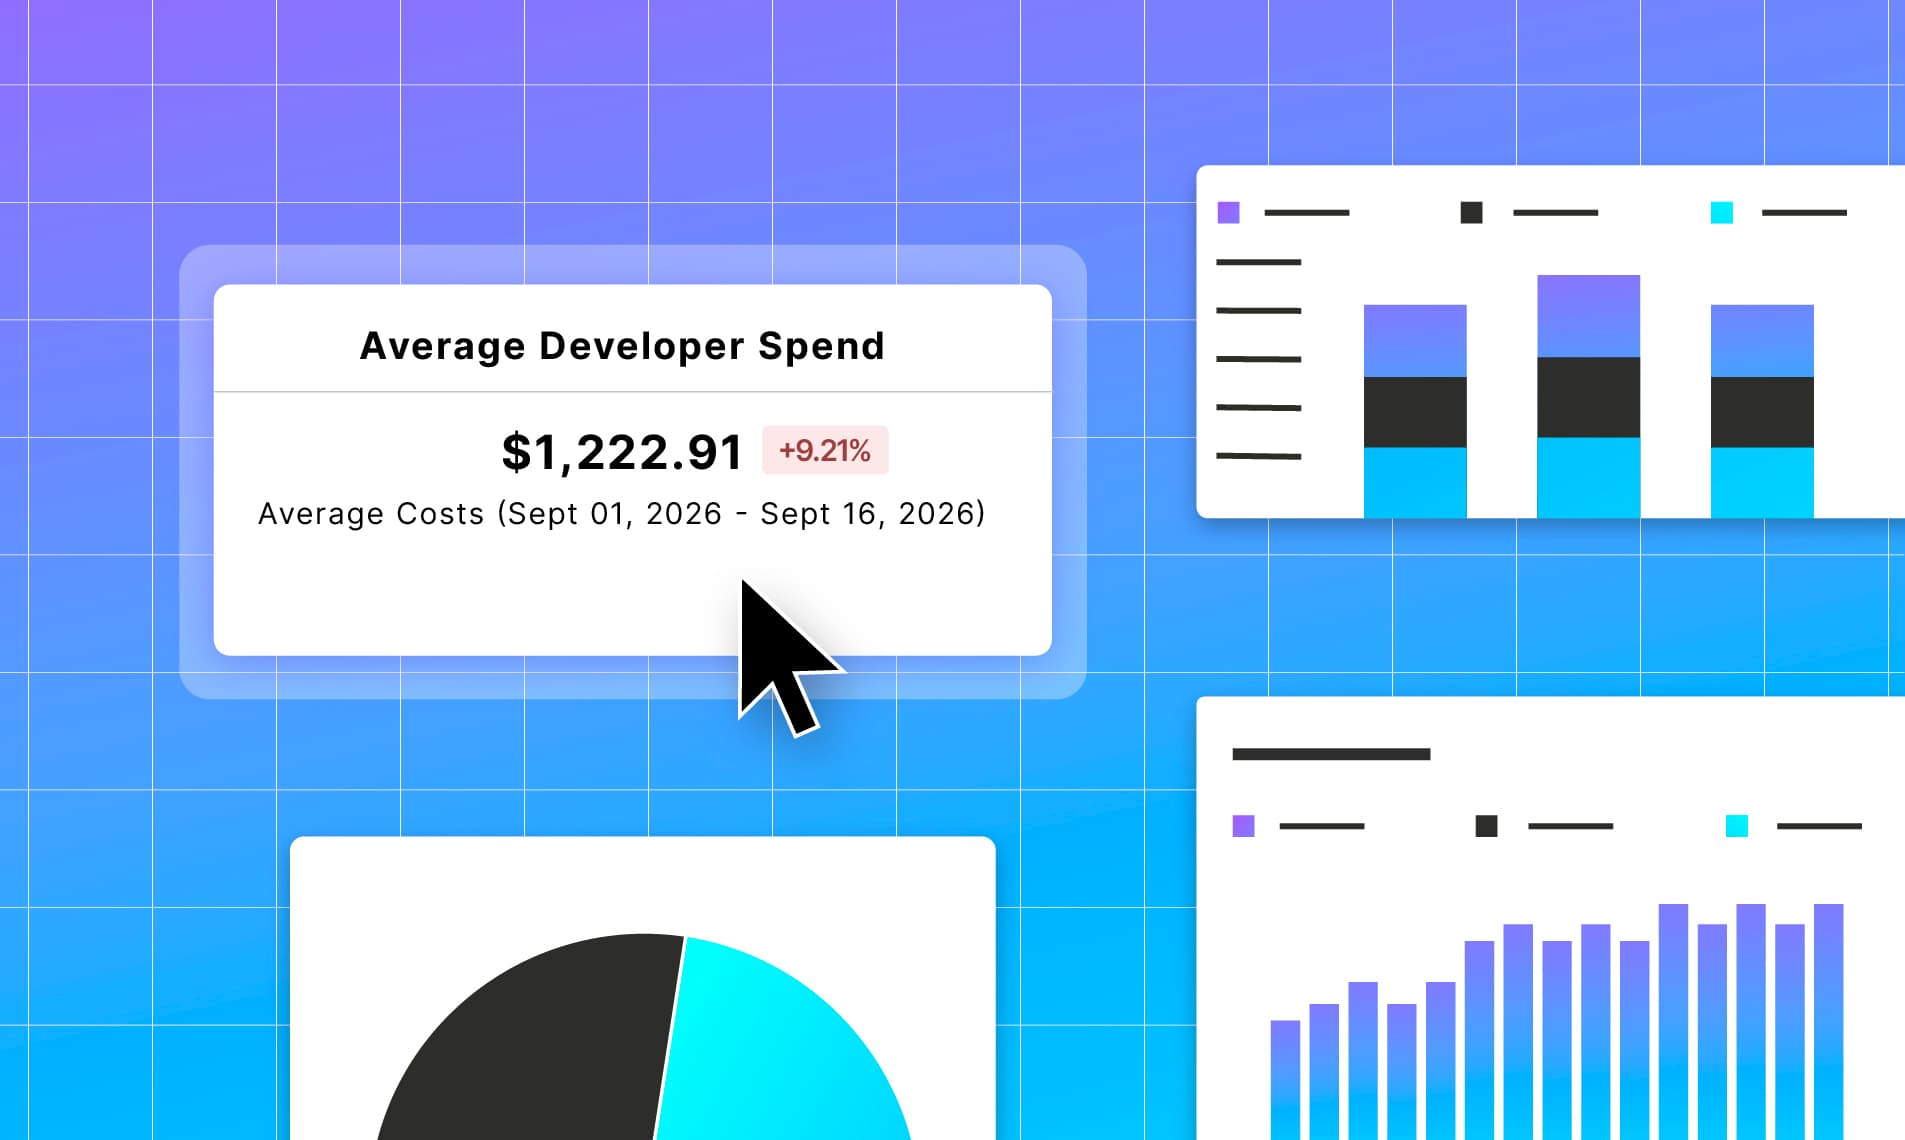

Today, Vantage is announcing KPI Widgets on Dashboards, which let FinOps and engineering leaders pin key metrics from Cost Reports, Business Metrics, Kubernetes Efficiency Reports, and more without the chart clutter of a full report widget. This gives every audience a simple way to understand KPIs such as per-unit cost, average cost, and instance count at a glance.
Customers use Dashboards to guide cost review meetings, track application spend and usage trends, and report progress toward organizational goals to executive audiences. Report Widgets, however, consist of charts, tables, lists, and other elements unique to each report type, making it difficult to call attention to key metrics for executive or operational dashboards.
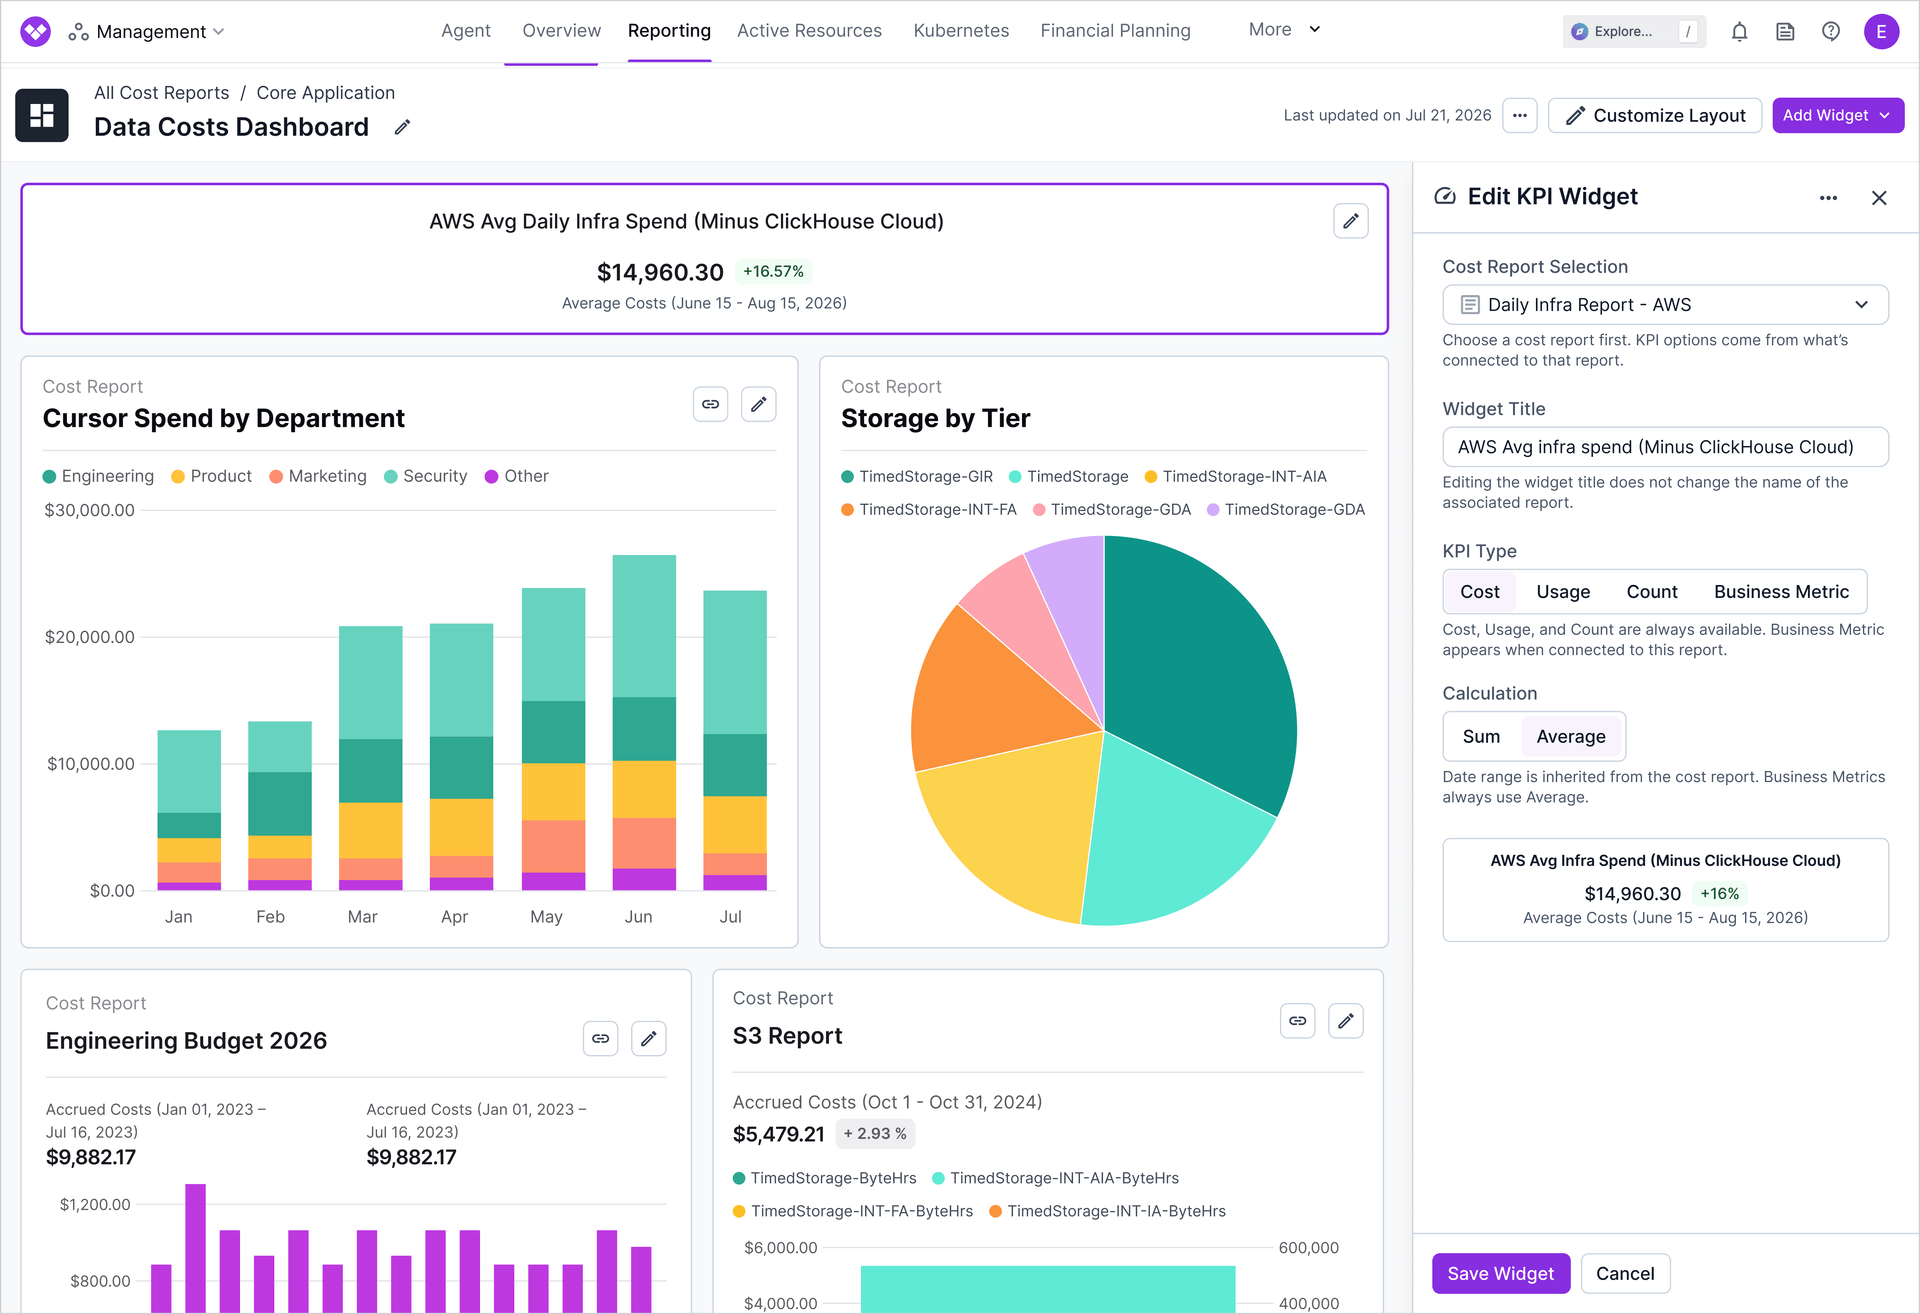
Now, customers can use KPI Widgets on any Vantage Dashboard to highlight the key metrics that matter most, helping viewers understand key results at a glance without digging into Cost Report data. To add one, navigate to a dashboard and select Add Widget, then KPI, choose a Cost Report, Business Metric, Budget, or any of the supported widgets and configure the widget’s title, KPI type, and calculation in a side panel. A preview shows how the KPI will appear before you add the widget to the Dashboard. Each widget displays the primary value, a period-over-period change badge, and a date range label. KPI Widgets follow the Dashboard’s date range, period, and saved filters while respecting the selected Cost Report’s filters and groupings. FinOps teams can arrange several KPIs side by side at the top of a Dashboard, with charts and reports below to provide more detail.
KPI Widgets are available on Dashboards in the Vantage console. To get started, open a Dashboard, click Add Widget, then select KPI. Learn more in the Dashboards documentation.
Frequently Asked Questions
1. What is being launched today?
KPI Widgets are a new Dashboard widget type that highlights the metrics most critical to tracking an enterprise’s cost, usage, efficiency, and more.
2. Who is the customer?
FinOps, finance, engineering, and executive stakeholders who use Dashboards to monitor cost and usage. KPI Widgets are especially useful on shared executive or operational Dashboards where a Total or Average needs to stand out without a full report visualization.
3. How much does this cost?
There is no additional cost for KPI Widgets.
4. How do I create a KPI Widget?
Open a Dashboard and choose Add Widget, then select KPI. In Add KPI Widget, select a Cost Report, Business Metric, Budget, Financial Commitment Report, or Kubernetes Efficiency Report as the Source, then choose the available Type or KPI.
For Cost Reports, choose Cost, Usage, Count, or an attached Business Metric. For Usage, also select a Usage Unit. Cost, Usage, and Count support Sum or Average; an attached Business Metric uses Average. Other sources use their source-specific metric without a Sum or Average selector.
Set a Widget Title, review the preview, and click Add Widget.
5. What KPI Types can I choose?
The available options depend on the selected source:
- Cost Report: Cost, Usage, Count, or Business Metric. Business Metric appears only when the report has one attached and uses the report’s default Business Metric. Usage is filtered to a selected Usage Unit.
- Business Metric: Raw Amount over the Dashboard’s date range. To show Unit Cost, Usage Unit Cost, or Gross Margin, select a Cost Report with the relevant Business Metric attached.
- Budget: Current Performance or Projected Performance, showing the amount under or over budget for the budget’s current period, with an under, over, or at risk badge as applicable.
- Financial Commitment Report: Total Savings, Coverage, or Effective Savings Rate (ESR).
- Kubernetes Efficiency Report: Idle Costs, Total Cost, or Cost Efficiency.
6. What happens if the Dashboard date range or filters change?
Cost Report KPIs use the Dashboard’s date range, period, and saved filters when set, overriding the report’s saved time settings. The Cost Report still defines what the KPI measures: changes to its filters or groupings are reflected in the KPI.
Standalone Business Metric Widgets use the Dashboard’s date range. Financial Commitment Report and Kubernetes Efficiency Report KPIs also follow the Dashboard’s dates and period while retaining their own report filters. Dashboard saved filters apply to Cost Report KPIs, not these other sources.
Budget KPIs use the budget’s current period and do not change with the Dashboard’s date range or saved filters.
7. What is the difference between Sum and Average?
For Cost Report Cost, Usage, and Count KPIs, Sum adds the values across every date bin in the Dashboard’s effective period into a single total. Average divides that total by the number of date bins in the period, including empty bins.
Business Metrics attached to a Cost Report always use Average. A standalone Business Metric shows raw Amount summed over the Dashboard’s date range. Budget, Financial Commitment Report, and Kubernetes Efficiency Report KPIs use their source-specific metrics rather than a selectable Sum or Average calculation.
8. Who can create or edit KPI Widgets?
Users with Editor or Owner access on the Dashboard can add, edit, duplicate, or delete KPI Widgets. Viewers can see KPI values but cannot add or change widgets. Users also need permission to access the underlying source.
9. What happens if the Cost Report has no data for the selected period?
The widget shows a “No Data Available” state. For Cost, Usage, and Count KPIs, the period-over-period change badge is omitted unless the previous-period value is greater than zero. Business Metrics attached to a Cost Report show an avg. tag instead of a percentage change.
Standalone Business Metric, Financial Commitment Report, and Kubernetes Efficiency Report KPIs do not show a period-over-period change badge. Budget KPIs show an under, over, or at risk badge instead.
10. Is there a limit to how many KPI Widgets I can add?
There is no specific KPI Widget limit, but Dashboards are limited to 50 widgets total. KPI Widgets count toward that limit, along with Report and Free Text widgets.
11. Can I create KPI Widgets via the API?
Yes through the Dashboards API. For a Cost Report KPI Widget, set display_type to kpi and kpi_calculation to sum or average. Use kpi_type to select Cost, Usage, Count, or an attached Business Metric, and kpi_usage_unit for Usage. An attached Business Metric uses average. The API does not expose the kpi_metric selector used for other sources in the console.
For example:
12. Can I create KPI Widgets via Terraform?
Yes, you can create and manage Cost Report KPI Widgets with Terraform. The provider supports display_type, kpi_calculation, kpi_type, and kpi_usage_unit; it does not expose the kpi_metric selector used for other sources in the console.
For example:
13. Can I create KPI Widgets with the FinOps Agent and MCP?
Yes, you can create and manage Cost Report KPI Widgets using the FinOps agent and MCP Server. These tools support Cost, Usage, Count, and attached Business Metrics; they do not expose the kpi_metric selector used for other sources in the console.
Sign up for a free trial.
Get started with tracking your cloud costs.
Read more
Vantage Launches Support for Azure and GCP Financial Commitment Reports
Vantage Launches Support for OpenRouter Costs
Vantage Launches Token Allocation Support for LiteLLM
Vantage Launches Fractional GPU Cost Allocation Support Leveraging NVIDIA MIG