FinOps as Code: Using Terraform to Build a Cost Reporting Structure
Create your entire cost reporting structure inside Vantage—in seconds—with Terraform.

Effective cost management is critical for organizations to optimize their cloud spending and align it with business objectives. FinOps, a methodology that brings together finance, operations, and technology teams to manage cloud costs effectively, emphasizes the importance of a well-structured business unit hierarchy and robust cost-tagging practices. FinOps as Code takes this methodology one step further and uses Infrastructure as Code principles to re-create your business structure in a third-party cost optimization tool, like Vantage, so you can visualize your organization's structure alongside accrued costs. In this post, we'll use Terraform to demonstrate how to set up an organization structure within Vantage.
If you are just getting started with Terraform, see our introduction to Terraform and FinOps as Code.
The Scenario: Use Terraform to Set Up Your Organization Structure
You have just started using Vantage. Your organization has a structure where high-level business units comprise multiple teams. Each team has a designated cost center. You want to view costs per team/cost center. Different stakeholders—such as management seeking high-level insights and engineers requiring detailed technical data—often have distinct preferences for the types and granularity of reports they rely on for decision-making. With this point in mind, you also want to create dashboards for each business unit that contain all team visualizations.
You have a structured YAML file that contains your organization map. We'll use Terraform to iterate over that map and create corresponding Vantage resources, as depicted in the diagram below.
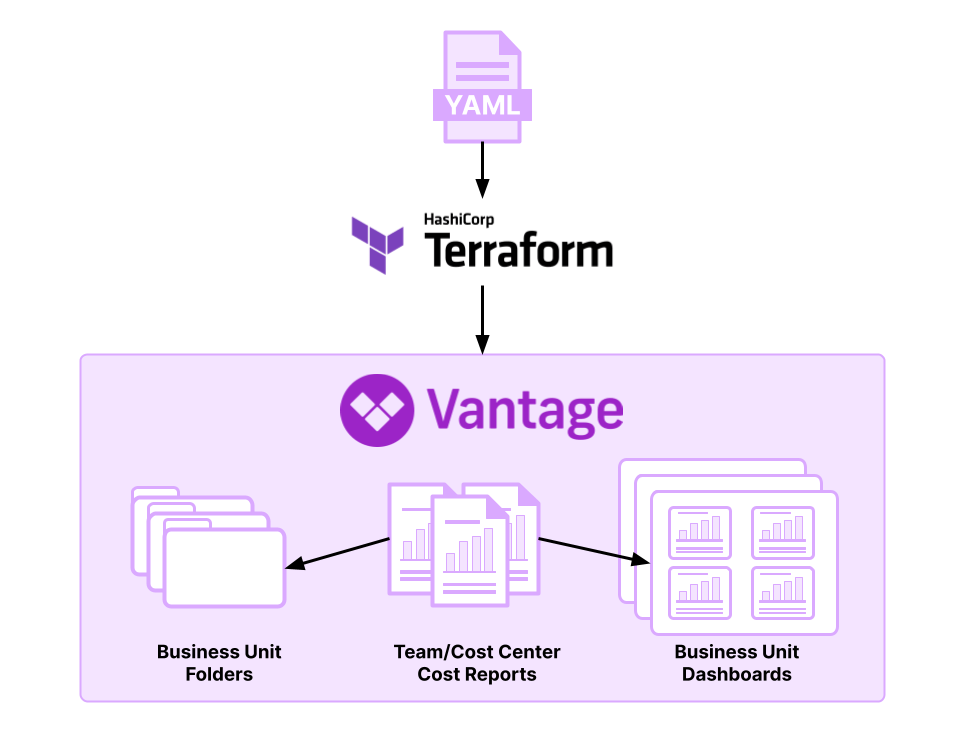
In this demo, we’ll use the Vantage Terraform provider to complete the following steps:
- Create a set of folders in Vantage for each business unit.
- Create a set of Cost Reports for each team.
- Your company tags resources based on a
cost_centertag. Each team's Cost Report will be filtered by its correspondingcost_centertag to include only costs attributed to that team/cost center.
- Your company tags resources based on a
- Create a dashboard for each business unit that contains the Cost Reports for its associated teams.
We'll use the below example organization structure—yet, envision this structure on a larger scale to truly appreciate the power of automation and Terraform.
Prerequisites: Terraform and Vantage
This tutorial assumes you have an intermediate knowledge of Terraform. You should know how to create a basic configuration, have a basic understanding of for_each loops, and an understanding of how to use variables.
For Vantage, you'll need to be an organization owner with an active account and at least one provider connected. You'll also need a Vantage API token with READ and WRITE scopes enabled.
Demo: Automate Cost Reporting with Terraform
All demo files are also included in the FinOps as Code demo repo.
Export your Vantage API token as an environment variable.
Create a new project directory and move to it.
Ensure the YAML file is saved to this directory. (In this demo, we'll refer to this file as cost-centers.yaml.)
Create a Terraform configuration file and call it vantage.tf. Create variables.tf to store Vantage configuration variables.
Add the following variable block to variables.tf. The workspace_token is a Vantage workspace your organization uses (e.g., wrkspc_12345) and is where all folders and cost resources will be created. Navigate to the Workspace settings screen in Vantage and copy this token.
Step 1: Set Up the Provider Configuration
Open providers.tf and declare the Vantage provider. No additional provider configuration options are needed for Vantage.
Save the file and run the init command to initialize the configuration and download the latest provider.
Step 2: Create Local Variables to Store YAML Data
To iterate over the YAML structure, create two local variables in vantage.tf.
local.cost_centers decodes the contents of the YAML file with the yamldecode Terraform function. This process transforms the YAML data into a structured map format, where each key represents a unique cost center identifier, and its associated value is a nested map containing the business_unit and team. The example below demonstrates the structure of this variable.
local.business_units creates a set of unique business units (six in this example) based on local.cost_centers. The example below demonstrates the structure of this variable.
Step 3: Create the Business Unit Folders
To create the folders for each business unit, use a for_each loop to iterate over the local.business_units variable. Use the vantage_folder resource and assign the folders to the workspace_token you previously saved.
Step 4: Create the Team/Cost Center Cost Reports
Create the team/cost center Cost Reports with the vantage_cost_report resource.
- Iterate over the
local.cost_centersvariable, accessing theteamattribute as the value for the reporttitle. - Use the below expression for
folder_tokento dynamically retrieve the token of the folder associated with each team/cost center's business unit. - Configure the
filterparameter to use VQL—or Vantage Query Language—to create a filtered report. In this scenario, your organization uses GCP labels to tag resources by cost center. The VQL expression filters the Cost Report for GCP costs tagged with the team's associatedcost_center(each.key).
Step 5: Create the Business Unit Dashboards
The last step is to create a dashboard for each business unit that contains associated team/cost center Cost Reports. Use the vantage_dashboard resource. Each dashboard should display each Cost Report with the last six months of data, grouped by week.
- Use a
for_eachloop to iterate through thelocal.business_unitsvariable. - Configure the
widget_tokensparameter to iterate through thelocal.cost_centersvariable. The belowforexpression retrieves the tokens of any Cost Reports associated with the current business unit (each.value) and creates a list of these tokens to be used as widgets in the dashboard for that business unit. - Use the business unit name for each dashboard
title.
Deploy Your Terraform Configuration
Save your configuration and then deploy it with the plan and apply commands.
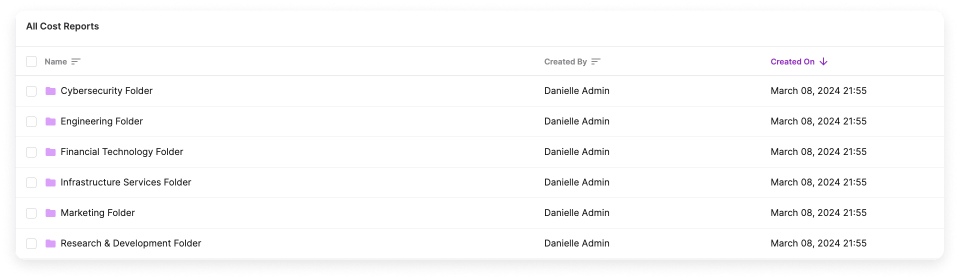
Once deployed, you should see a set of folders for each business unit.
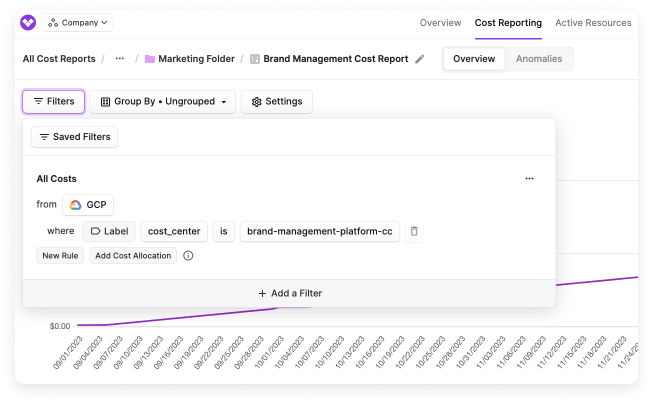
Each business unit folder should contain its corresponding teams' Cost Reports. Each Cost Report should be filtered to the corresponding GCP label/tag for the team's cost center. The below example shows the generated Cost Report for the Brand Management team, filtered to its corresponding cost center, brand-management-platform-cc.
You should also see a dashboard for each business unit that contains all associated team Cost Reports. In the below example, the Engineering dashboard contains both the Hardware Engineering and Software Engineering Cost Reports.

Conclusion
Automating your organization structure with Terraform highlights the efficiency of FinOps as Code. By incorporating Terraform into your FinOps as Code workflow, you can quickly create and manage cost resources, like folders, Cost Reports, and dashboards, tailored to your organizational units.
Sign up for a free trial.
Get started with tracking your cloud costs.