How to see S3 Bucket Request Metrics, Egress, and Costs
One consistent piece of feedback we hear from AWS customers using S3 is that its very difficult to understand where costs are coming from. S3 charges on three different verticals: for storage of the underlying objects, requests made to..
One consistent piece of feedback we hear from AWS customers using S3 is that its very difficult to understand where costs are coming from. S3 charges on three different verticals: for storage of the underlying objects, requests made to the bucket and for the egress of traffic out of a bucket. To add to the complexity there are different rates for different storage classes, different rates for different request types (i.e., GET vs POST) and the rates change depending on what region the bucket is in. Lastly, AWS doesn't enable metrics for even seeing some of this data by default so you're responsible to get things configured to keep track yourself.
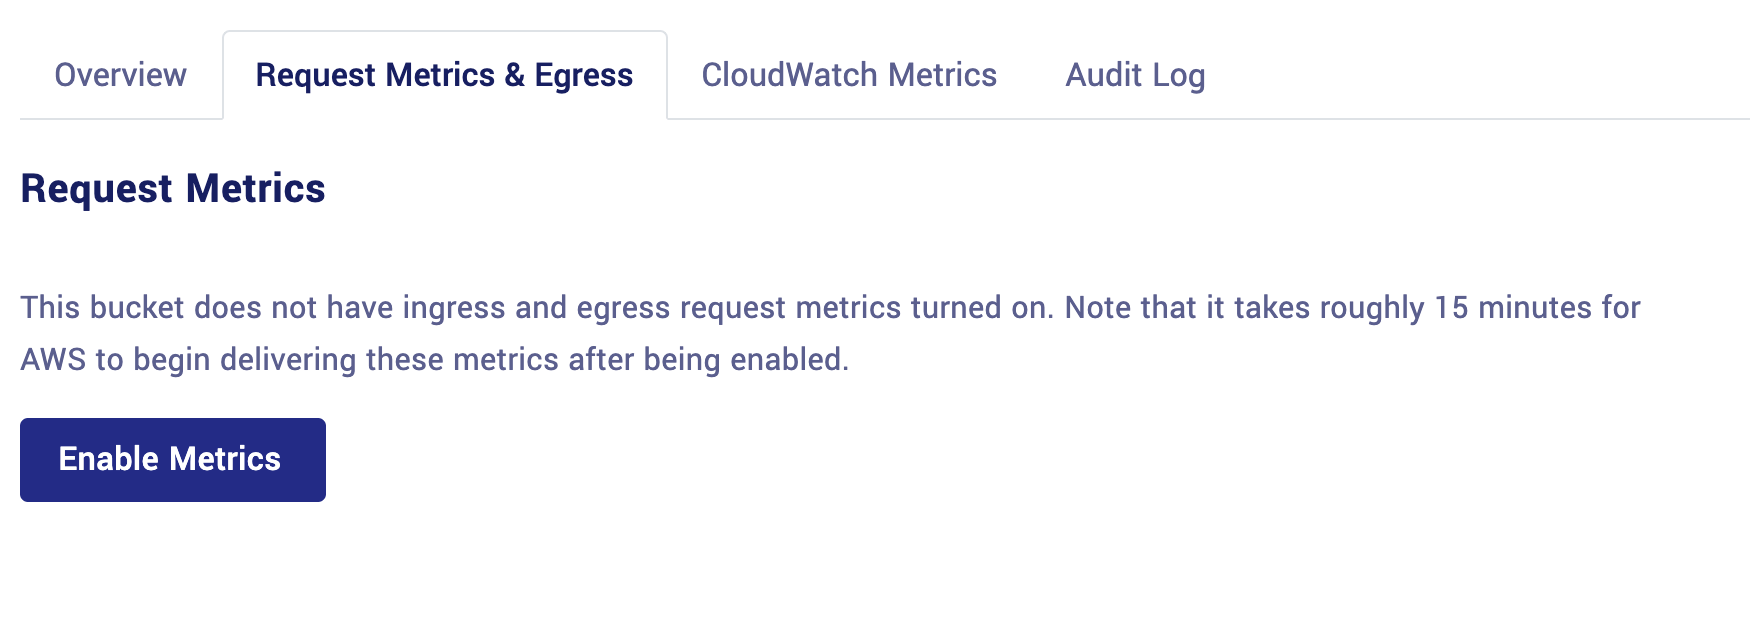
As of today: Vantage has launched a tool available to all users to help understand their S3 usage and accompanying costs. All S3 Buckets on Vantage now have a tab named "Request Metrics and Egress" that will assist you with enabling, configuring and viewing the proper metrics to see accompanying costs. When you navigate to an S3 bucket page and click the "Request Metrics and Egress" tab, Vantage will check to see if you have metrics enabled. In the event you don't, you'll see a button like the one below. Enabling request metrics merely informs AWS to begin collecting and storing these metrics for you on the desired bucket.
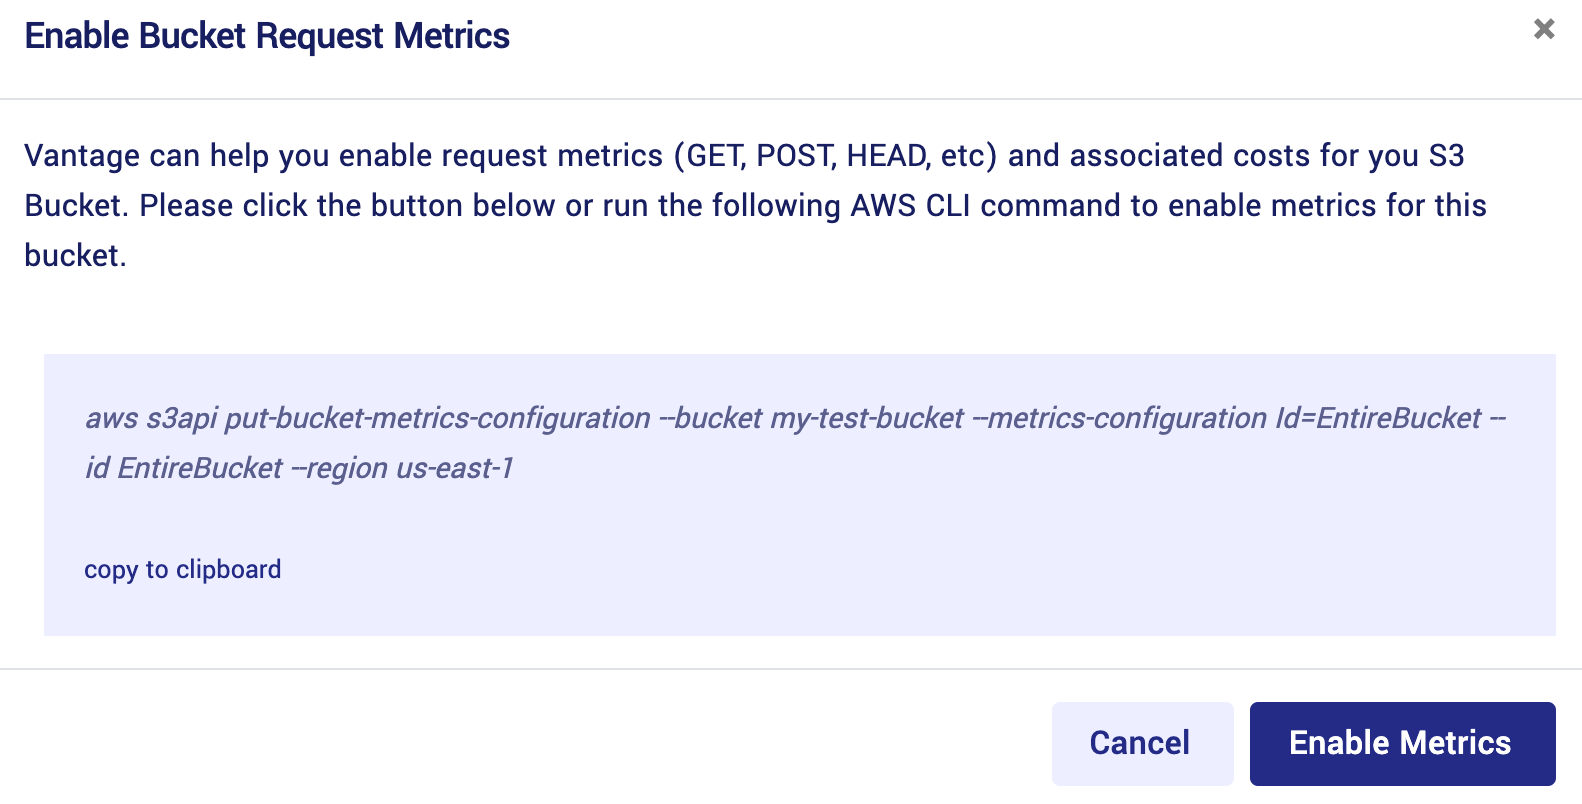
Upon clicking the "Enable Metrics" button, you'll see a modal pop up to enable these metrics. Vantage requires the IAM permission of "s3:PutMetricsConfiguration" to enable these metrics on your behalf. In the event you don't want to grant Vantage access to this permission, you're also provided with an AWS CLI equivalent command to run as shown below to enable these metrics:
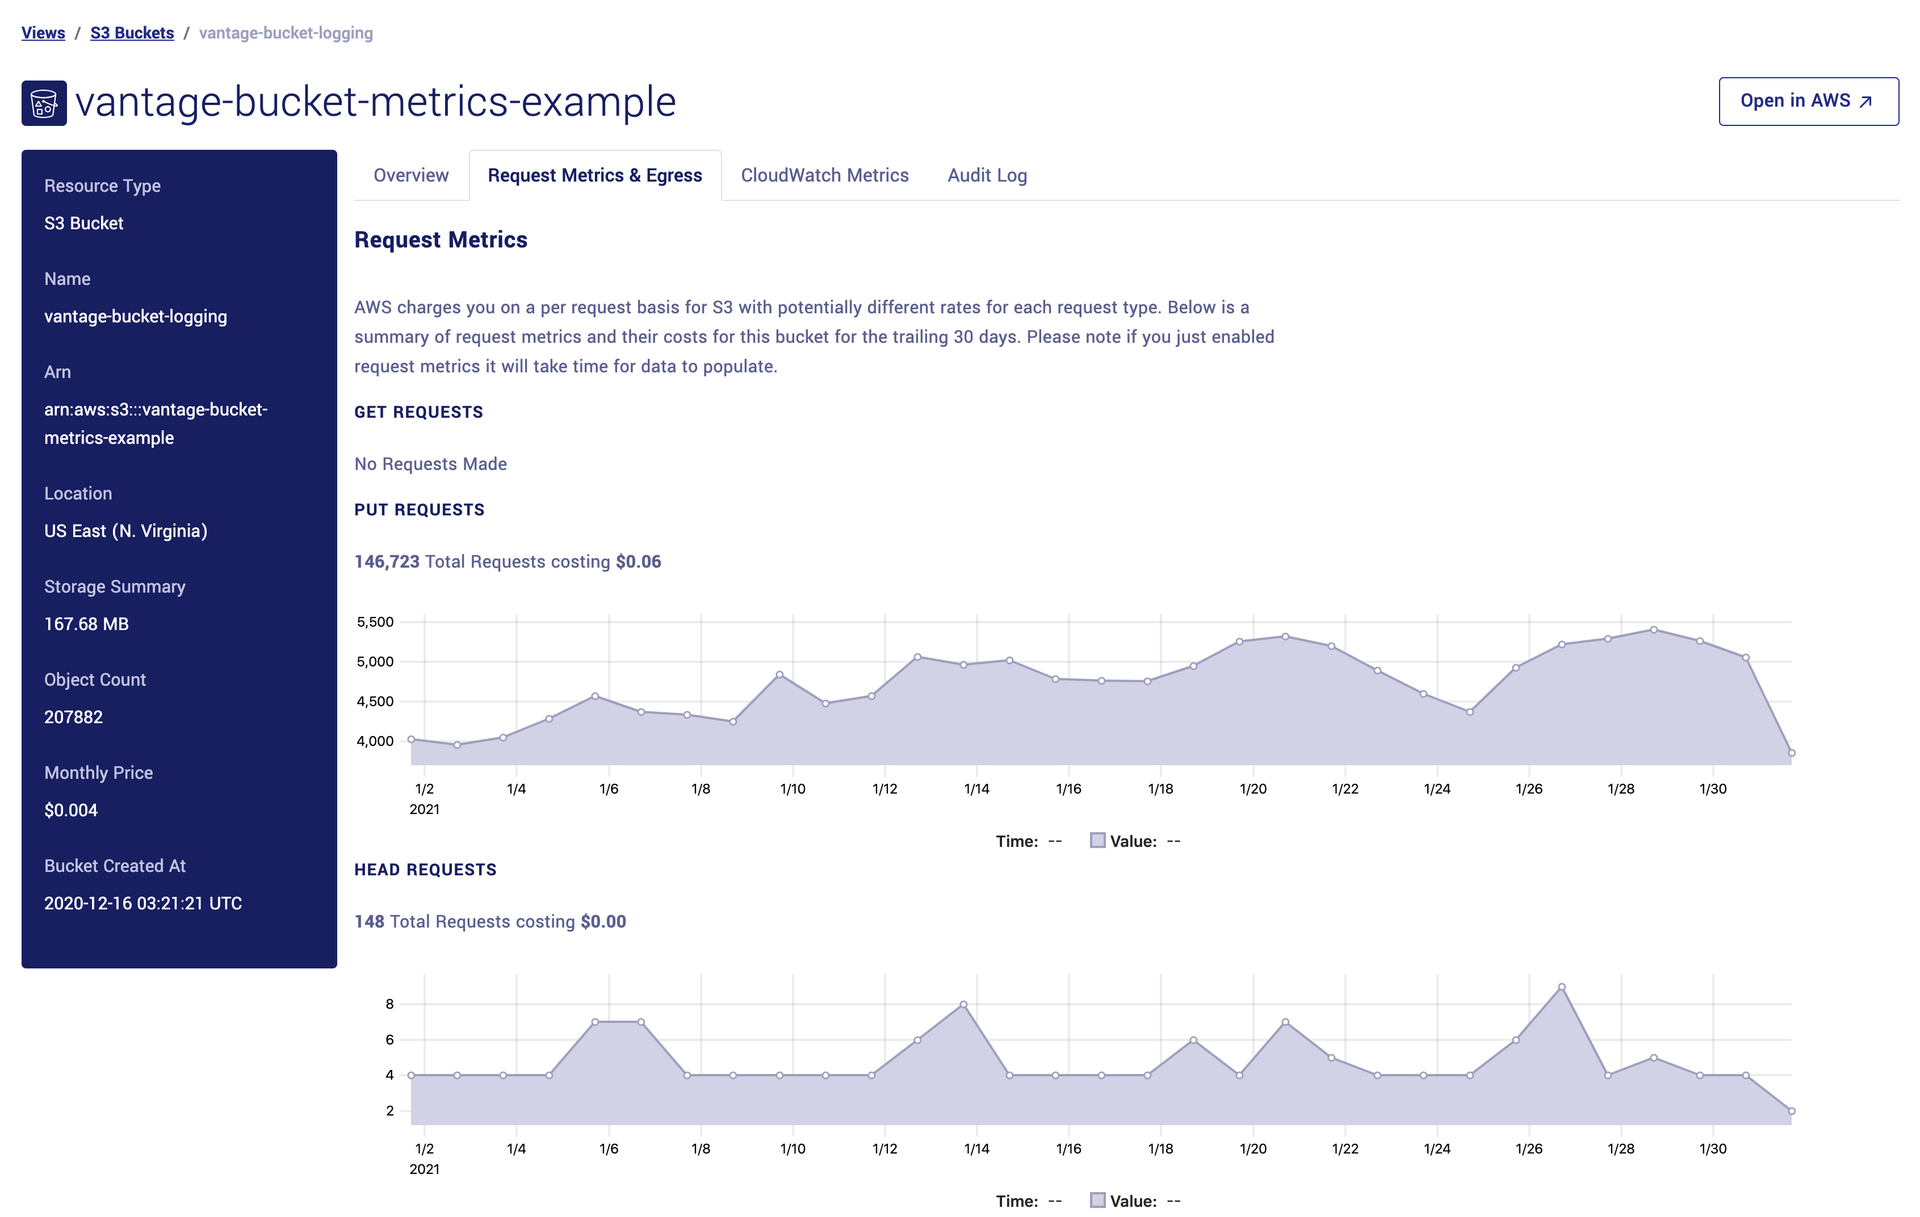
Once metrics are enabled, Vantage will be able to access them and provide you with reports and visualizations of what usage looks like. It's important to note that there is some delay imposed by AWS before these metrics are able to be retrieved by Vantage - so getting metrics enabled sooner rather than later will be helpful. These reports will give you a chart and cost estimate for each request type of GET, PUT, HEAD, POST, SELECT and LIST. Additionally, Vantage will give you a summary at the bottom of this page with your total egress for the bucket and what the rough costs are. Below is an example of what these charts look like:
Understanding your usage and behaviors can help you reduce costs, make important changes to your applications and uncover any issues that might result in a surprise bill at the end of the month. Vantage will also include these costs in weekly email reports to keep you informed ahead of time. Looking forward, we're looking to provide more robust tools around this feature to be able to see more granular stats on a per object basis.
We're always looking for ways to simplify the experience of managing your infrastructure and understanding where your costs are coming from. Have feedback or thoughts on this or other potential features?
Sign up for a free trial.
Get started with tracking your cloud costs.