Vantage Launches Expanded Forecasts: The Ability to Project Costs Six Months Ahead
Vantage now supports the ability to see forecasts six months into the future on Cost Reports.
Today, Vantage is launching the ability to see forecasts six months into the future. Customers can now select up to six months into the future when viewing a Cost Report.
Previously, forecasts on Cost Reports were limited to the current month; however, customers often want to view projected costs several months ahead for quarterly and yearly planning purposes. Due to the limited view within Vantage, customers needed to export the data out of Vantage in order to create their own expanded forecasts.
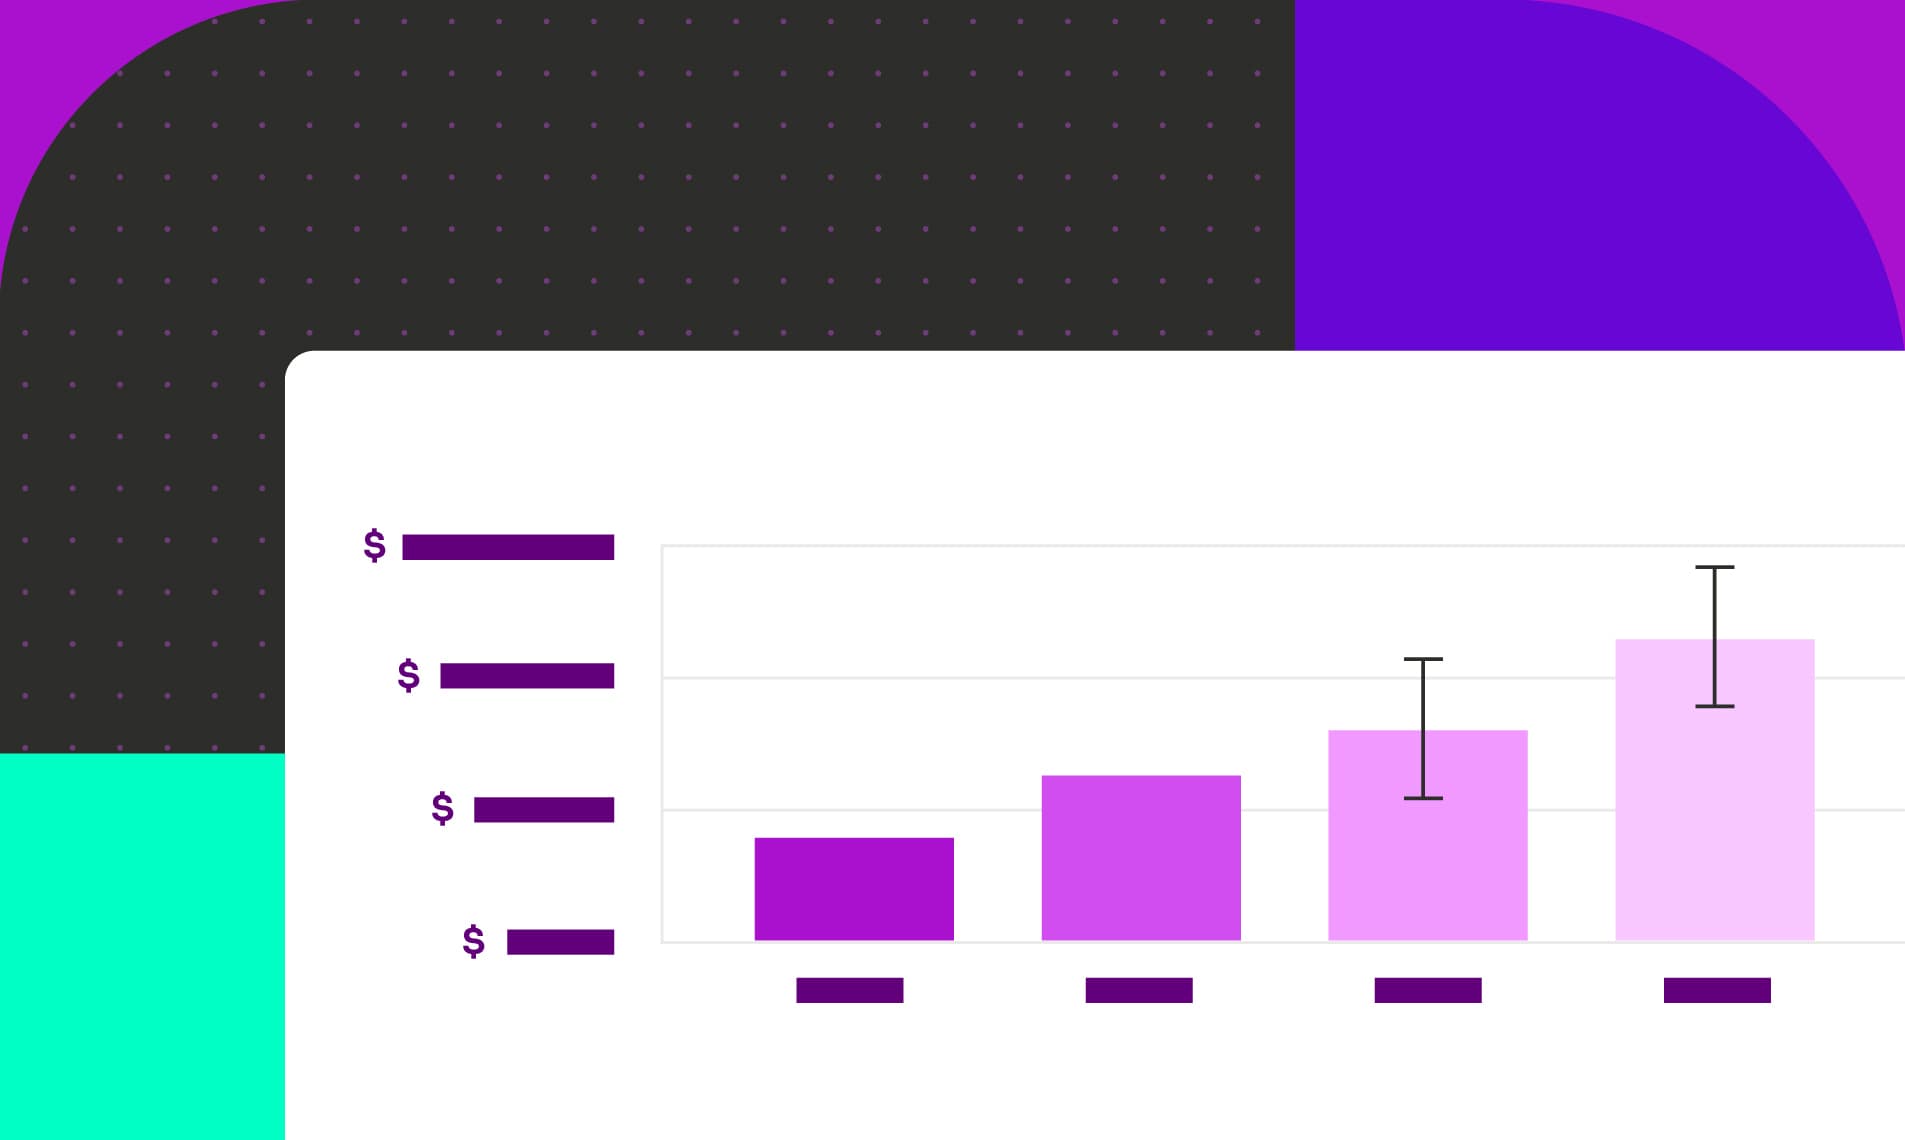
From the Cost Reports screen, you can now select a forecast period via the date picker. You can view projected costs for the upcoming month, the next three months, or the next six months. If you are an enterprise customer with an expanded retention period, your forecast range will be expanded to include the equivalent number of months. Reports can be saved with this future period and will also be reflected on the dashboard widget for the report. The bar chart view has also been expanded to display forecasts with error bars for forecasted periods.

A Cost Report with a future forecast in the console
This feature is now available for all users. To get started, navigate to any Cost Report and open the date picker. Select a Forecast Period and apply. To learn more about how to create Cost Reports, see the Cost Reports documentation. To learn more about forecasts in Vantage, see the Forecasting documentation.
Frequently Asked Questions
1. What is being launched today?
Today, Vantage is launching future forecasts past the current month. The default is six months, and enterprise customers can see the same number of future months they have set as their retention period.
2. Who is the customer?
The customer is any Vantage user who wants to see predicted costs. This feature is especially useful for quarterly and strategic planning to get an idea of future costs.
3. How much does this cost?
This feature is free to all users.
4. How are forecasts generated?
Vantage uses a time-series model and will run through all available data ingested into the platform on a per-service basis (e.g., EC2, RDS). These costs are forecasted into the future, taking into account seasonality or one-off spikes.
5. What forecasting ranges can I view costs by?
You can view forecasts for the current month, next month, and in three-month intervals. You can also select a custom date in the future to display on the report.
6. What reports can I see these forecasts on?
Forecasts are currently only available on Cost Reports.
7. Are forecasts available on all chart view types (e.g., bar, line, etc.)?
Forecasts are available on line charts and bar charts.
8. Are forecasts available for all date bins (e.g., cumulative, day, week, month)?
On line charts, forecasts are available for all date binning options. For bar charts, you can view forecasts for day, week, and month date bins.
9. I just created a new Cost Report. How long does it take for a forecast to initially generate?
Once a report is saved, the forecasts are immediately generated. The processing time depends on the amount of data contained in the filtered report, but it usually takes less than 10 minutes.
10. Are forecasts available for filtered or grouped data?
At this time, forecasts are only available per service and overall. When aggregating a report by other fields, the forecast will not be displayed.
11. Is it possible to expand the available dates beyond my current retention period?
You can contact support@vantage.sh to have this period modified.
12. Can I export these forecasts?
Not at this time, but this is on the roadmap.
Sign up for a free trial.
Get started with tracking your cloud costs.
Read more
Vantage Updates Temporal Cloud Integration to Use the Cloud Billing API

Vantage Launches SUM and CASE Statement Billing Rules
Vantage Launches MCP Connectors for the FinOps Agent
Vantage Launches Canvas: An AI-Enabled Business Intelligence Dashboard