Vantage Launches PDF Exports for Dashboards
Create exports of any dashboard to share outside Vantage.

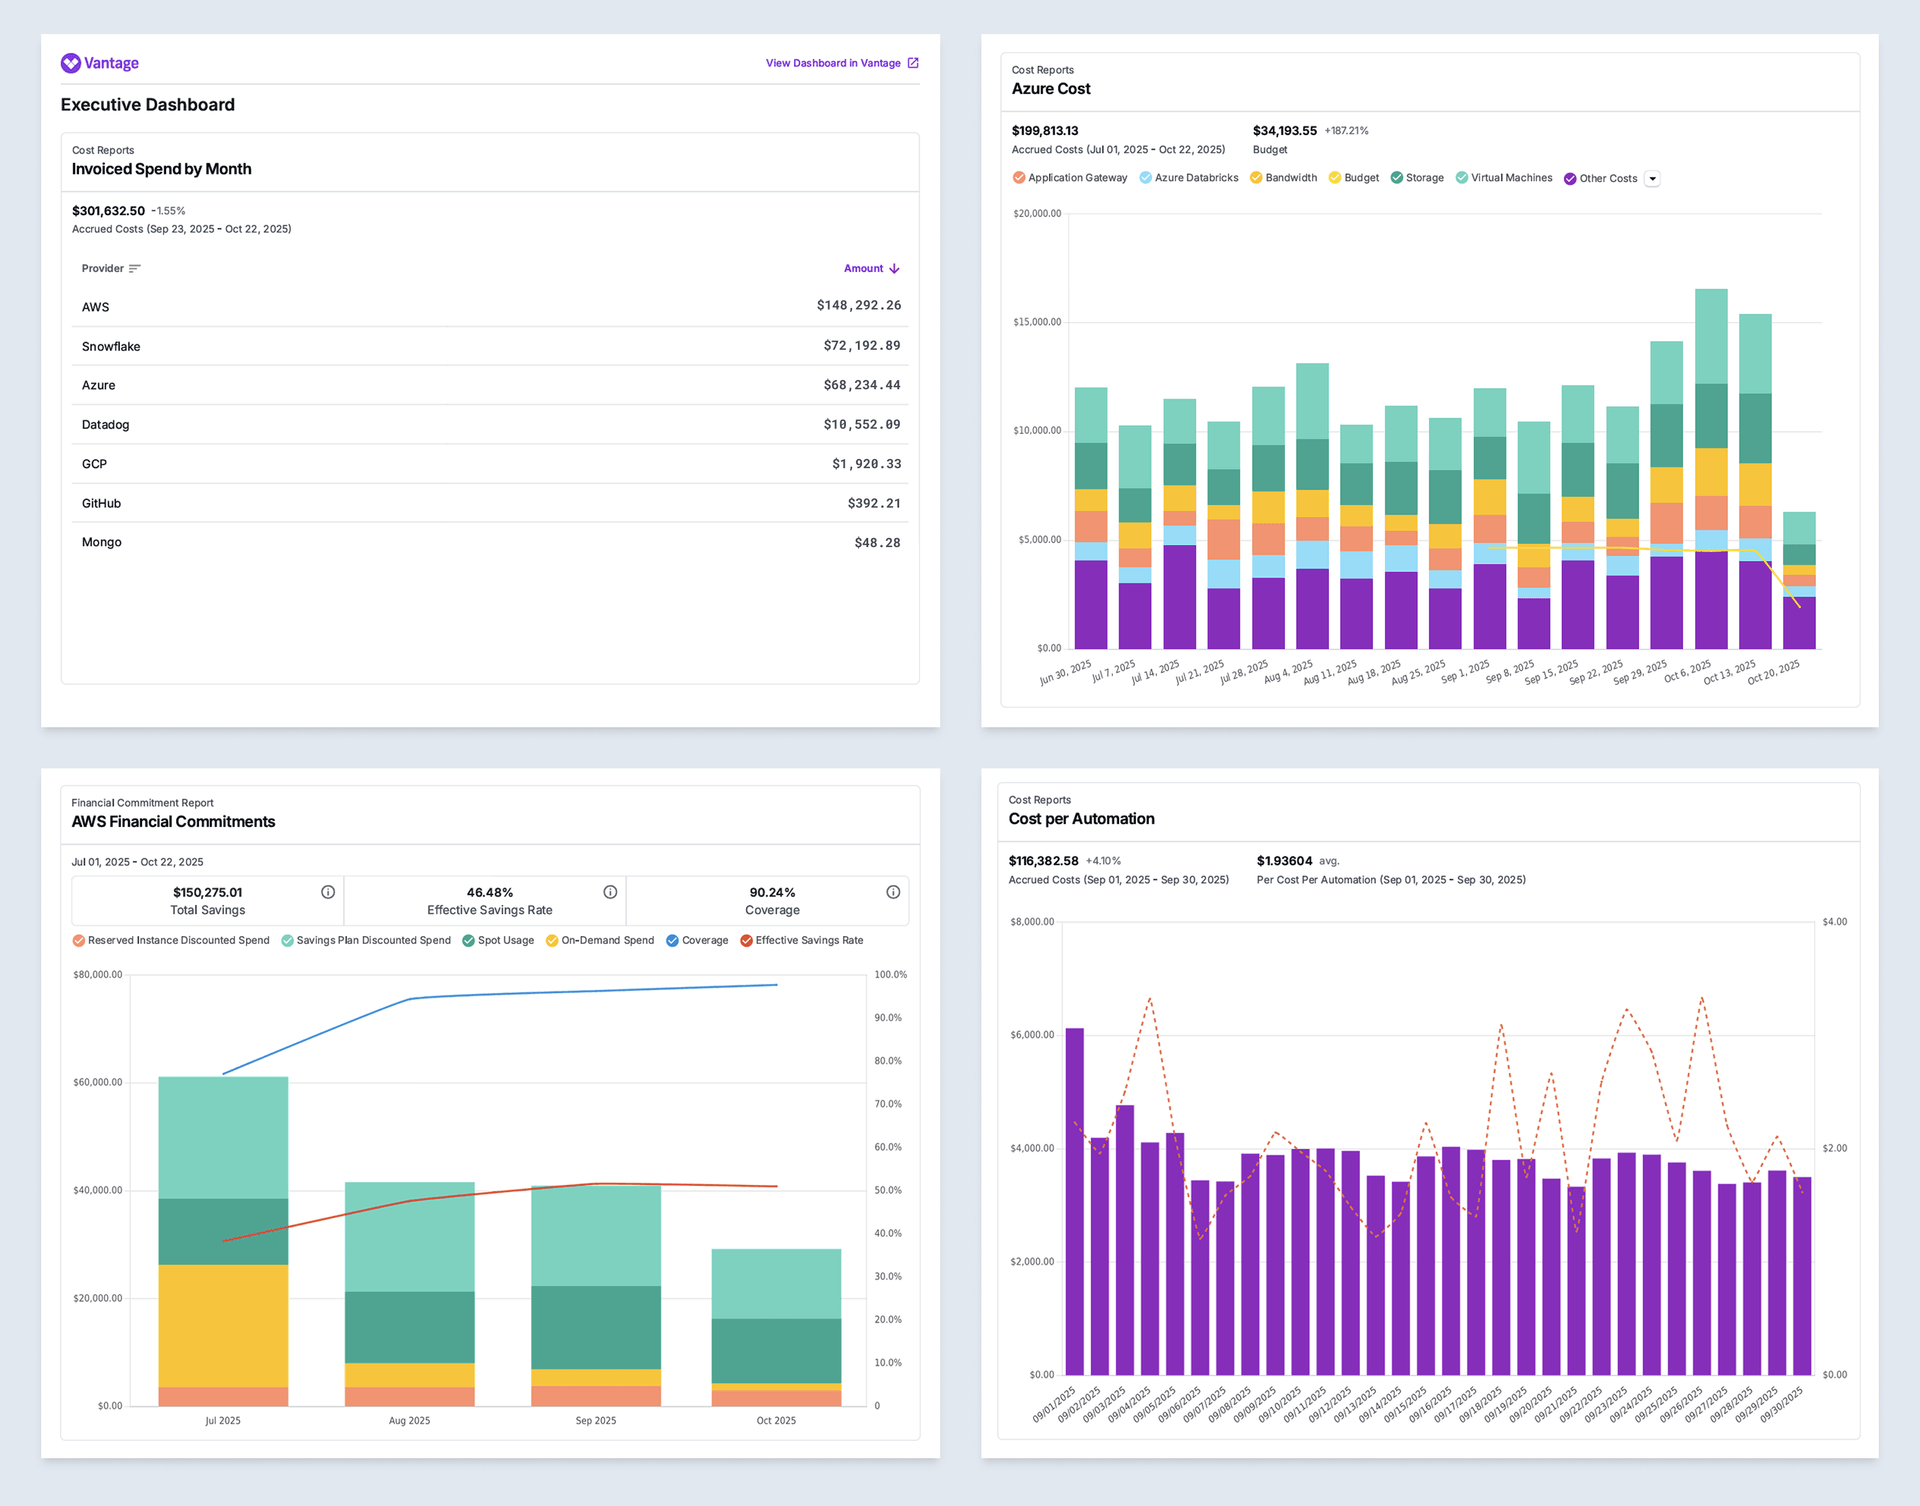
Today, Vantage is launching PDF Exports for Dashboards, allowing users to generate PDF representations of their cloud costs and usage for distribution. Customers can now perform visual exports of any Dashboard to share with stakeholders outside the Vantage platform.
Vantage customers utilize dashboards to aggregate and contextualize data across applications, teams, or business units into a centralized view to perform wide-scale cost and usage monitoring in a single location. Previously, customers could export Cost Reports to PDF, but Dashboards, which aggregate widgets of multiple Vantage report types, could only be shared through direct linking in the console. Users often want to export reports as PDFs for use cases like executive reporting, which allows for easier distribution and consumption without requiring recipients to log in to Vantage.
Now, Vantage customers can export PDFs of Dashboards to share cost and usage insights with stakeholders. From any Dashboard, users can click on the ellipses menu icon and select “Export as PDF”. A PDF of that view will be generated and sent to the Vantage users of their choice. The export will contain every widget on Dashboards, such as Cost Report charts and tables, Active Resource Reports, and Financial Commitment Reports, as its own page. Each PDF links back to the Dashboard it was generated from, so users can conduct more thorough analysis. This is ideal for executive reporting or out-of-console notifications to teams, informing them of their costs.
Dashboard PDF Exports are now available to all customers. To get started, navigate to any Dashboard in the Vantage console, and select “Export as PDF”. For more information, see the Dashboards documentation.
Frequently Asked Questions
1. What is being launched today?
Vantage is launching PDF Exports for Dashboards. Customers can now export any Dashboard as a PDF for analysis outside the Vantage console.
2. Who is the customer?
Any Vantage user with access to Dashboards can export them as PDFs. This includes FinOps teams, engineering leaders, and finance partners who need to share or archive periodic cost data.
3. How much does this cost?
There is no additional cost to export Dashboards to PDF.
4. How do I export a Dashboard as a PDF?
From any Dashboard, click the ellipses icon in the top-right corner, and from the dropdown, select “Export as PDF”. Vantage will generate a multi-page PDF with one widget per page. The export preserves chart filters, formatting, and date range selections at the time of export.
5. Which widgets can be exported in Dashboard PDFs?
All widgets that can be added to Dashboards are compatible with export (see the documentation for all supported report types). For table widgets, Vantage will display the first 12 rows to ensure readability and consistent layout across pages. For more granular exports of tables, utilize native CSV exporting for each report.
6. Can I perform Dashboard Exports via Slack?
No, at this time, Dashboard Exports are only supported via email.
7. If I change the date range on my Dashboard or apply a saved filter, will that be reflected on my export?
Yes, the dashboard will be exported in the same view as its current configuration in the UI.
8. What orientation does the PDF export come in?
All PDF exports come in the landscape orientation to optimize the layout of the chart.
9. Are Dashboard exports supported via API?
API support for retrieving PDF downloads is coming soon.
10. What is the limit to the number of widgets on a Dashboard?
Dashboards have a limit of 50 widgets; the PDF will generate with the same number.
11. Can I schedule automated delivery of Dashboard PDFs?
Not at this time, however, this will be available soon.
Sign up for a free trial.
Get started with tracking your cloud costs.