Vantage Launches Additional Cost Report Visualizations
Vantage launches additional Cost Report visualization options, including pie charts, expanded date bin selections for area and line charts, and multi-line charts.
Today, Vantage is launching additional visualization options for Cost Reports. Customers now have the ability toggle between new chart view options, like pie charts. Customers can also select expanded date binning options for line charts and area charts. In addition, customers can now view multi-line charts for grouped cost data.
Previously, on Cost Reports, customers could toggle only between area charts, single-line charts, and bar charts. Area and line charts were limited to a cumulative view. In addition, line charts showed only one line for overall costs and were unable to be grouped. Customers were also unable to create a visualization that showed the overall percentage of costs per service or other grouping. These options limited customers to a smaller set of visualizations.
Now, customers can create reports with an expanded set of visualization options. With the new pie chart visualization option, customers can see the overall percentage of costs per service or another grouping. This pie chart option is particularly useful on segment reports and provides a high-level view where each part of the pie chart represents the total percentage of costs allocated to a given segment.
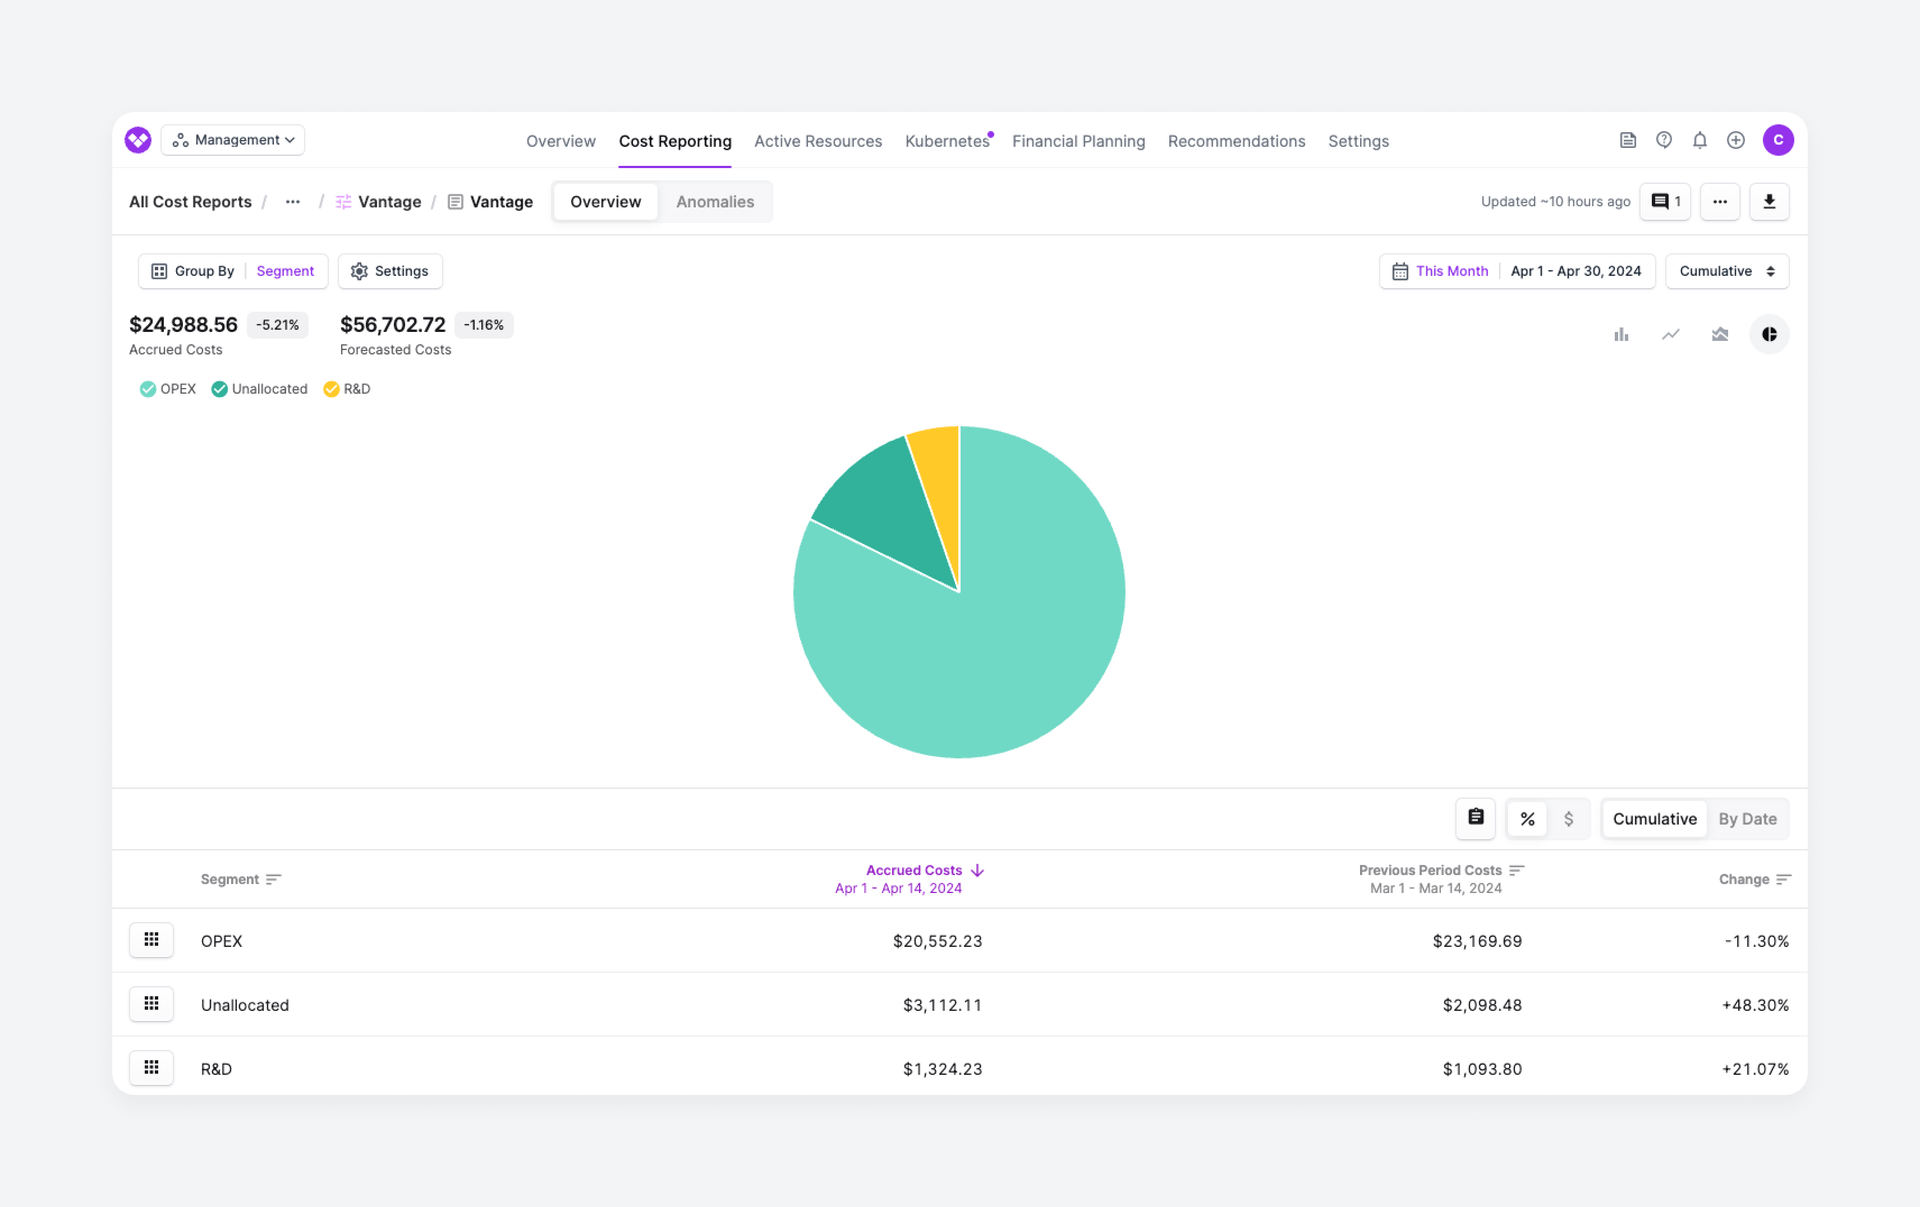
A Cost Report displayed as a pie chart in the console
On line and area charts, customers can now select from additional date bin options. In addition to a cumulative view, the daily, weekly, and monthly date bins are now available on both line and area charts. Previous period costs, current accrued costs, and forecasted costs, when available, are available on these chart visualizations.
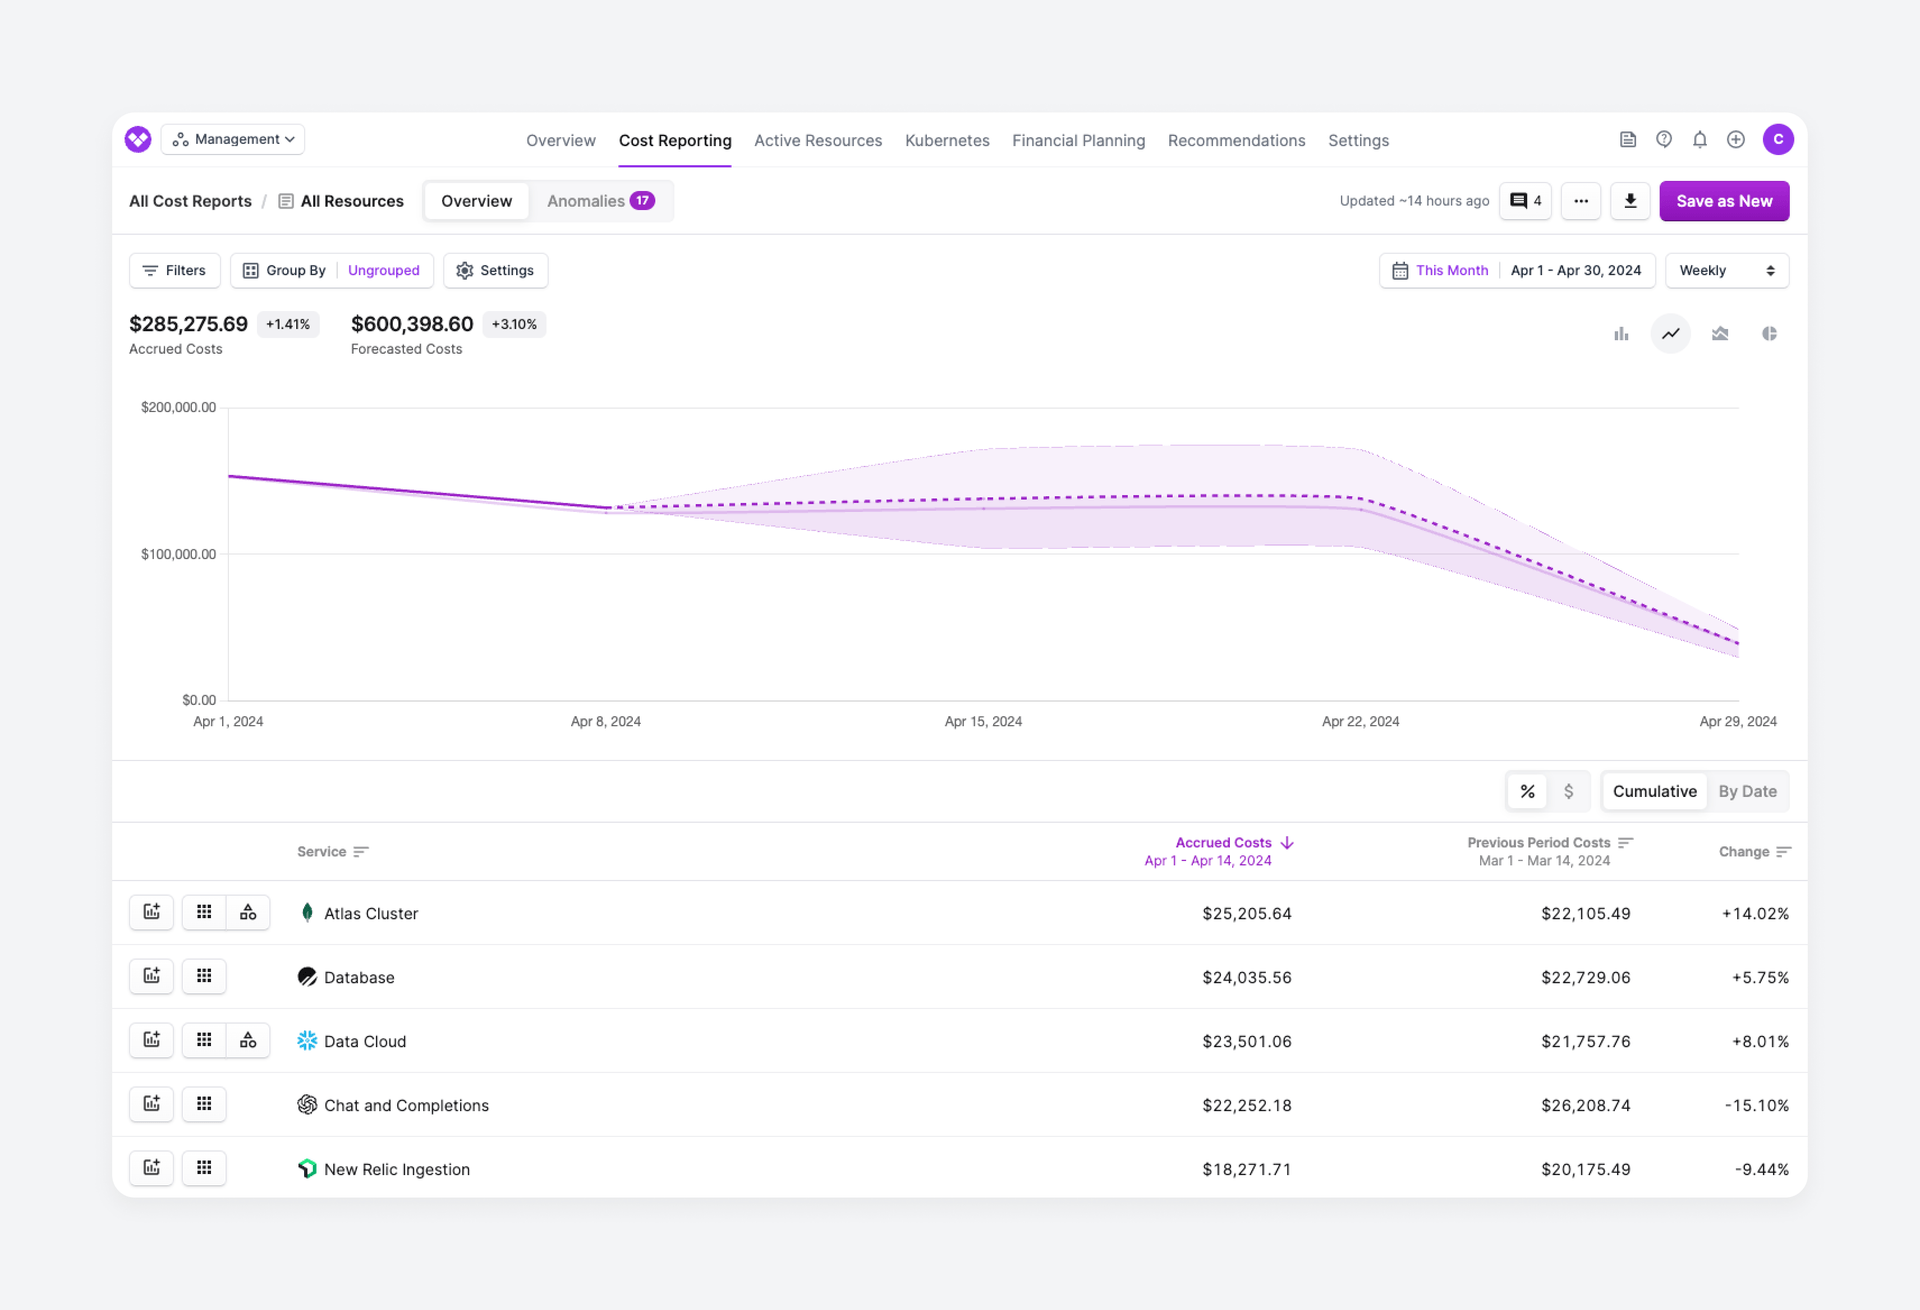
A line chart with a weekly date bin applied
You can also view multi-line charts for grouped cost data. Each line on the chart represents a specific group, like service, resource, etc. The key above the chart indicates the color of the line for that specific group.
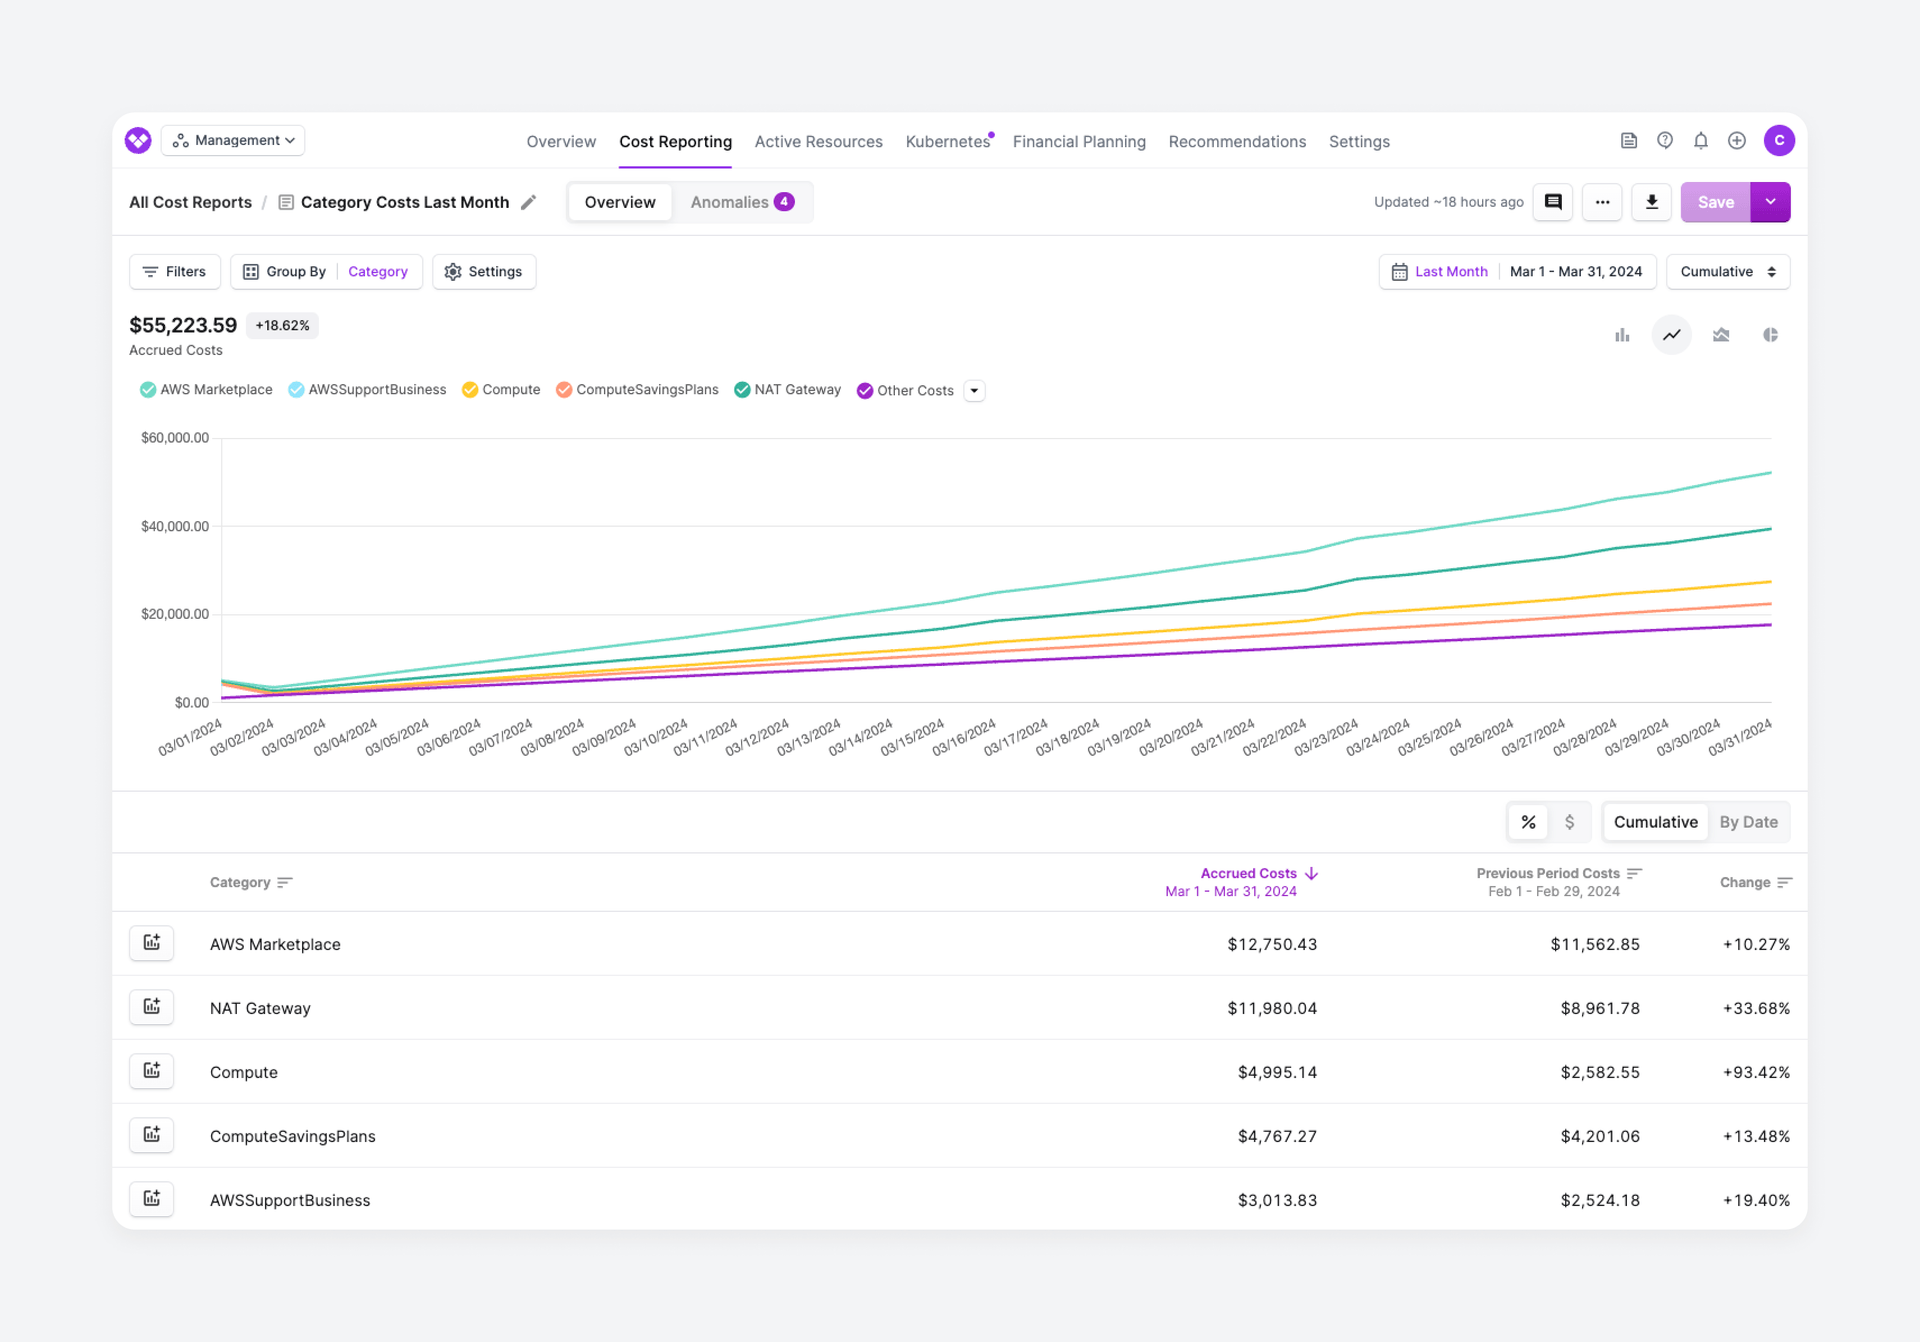
A multi-line chart for grouped cost data
These new visualizations are now available for all users. To get started, navigate to any Cost Report and select an available chart option on the top right of the chart. To learn more about how to create Cost Reports, see the Cost Reports documentation.
Frequently Asked Questions
1. What is being launched today?
Today, Vantage is launching additional Cost Report visualizations. Customers can now select pie charts as a visualization option and also have access to additional date bin selections for line and area charts.
2. Who is the customer?
The customer is any Vantage user who wants to explore Cost Reports and slice data across a larger set of visualization options. These new options provide users with even greater ability to understand their cloud costs.
3. How much does this cost?
This feature is free to all users.
4. What chart types are available?
You can toggle between line charts, bar charts, area charts, and pie charts.
5. Which date bin options can I view for each chart type?
For the cumulative date bin, you can view line charts, pie charts, and area charts. For daily, weekly, or monthly bins, you can view bar charts, line charts, and area charts.
6. Can I see these new chart types on a Cost Report widget within a dashboard?
Yes, these new report visualizations are available and represented on corresponding dashboard widgets.
7. Are these visualization options available on segment reports?
Yes, these options are all available on segment reports.
Sign up for a free trial.
Get started with tracking your cloud costs.
Read more
Vantage Updates Temporal Cloud Integration to Use the Cloud Billing API

Vantage Launches SUM and CASE Statement Billing Rules
Vantage Launches MCP Connectors for the FinOps Agent
Vantage Launches Canvas: An AI-Enabled Business Intelligence Dashboard